OLD CITY HALL - Building Grounds
Civic Square, one of the city's strongest overall (score 53, rank ~98th percentile). Strongest: edge activation; weakest: natural comfort.
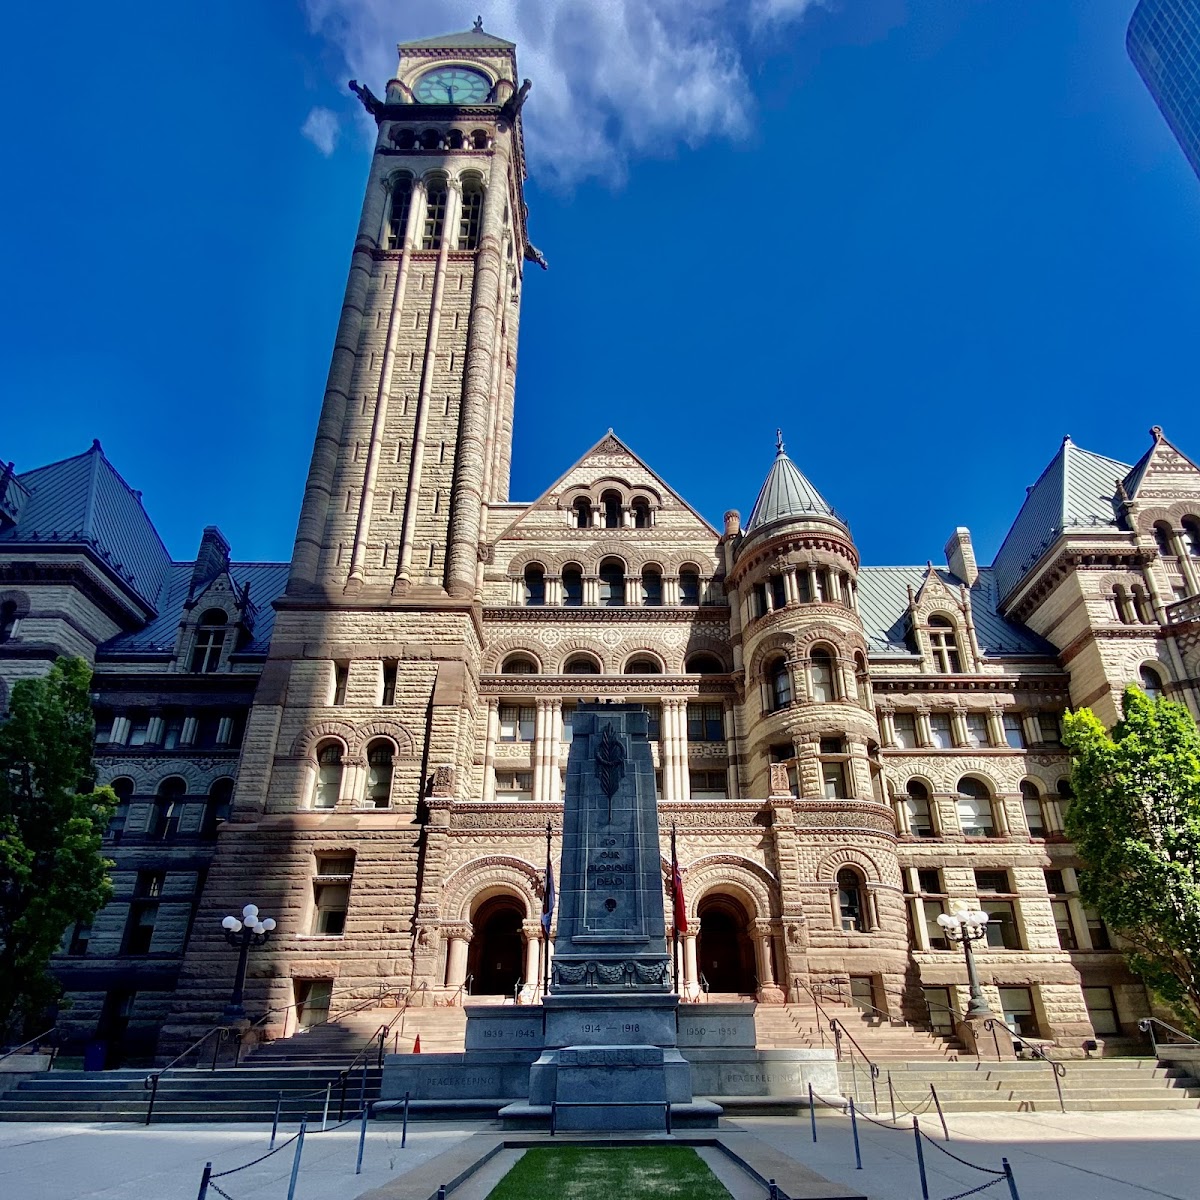
Photo by Roxanne Shewchuk via Google Places · cached 5/9/2026
OLD CITY HALL - Building Grounds scores 52.9 / 100. Strongest dimensions: enclosure / eyes on park and edge activation. Weakest: amenity diversity (0). Border-vacuum risk is low. This score is a transparent reading of Jane Jacobs-style vitality factors, not a definitive judgment.
Area · 1.13 ha
Weighted across six dimensions · confidence 59%
Scores are not bell-curved. Percentiles and expected scores provide context without changing the underlying model.
Loading map…
The parks map is loading.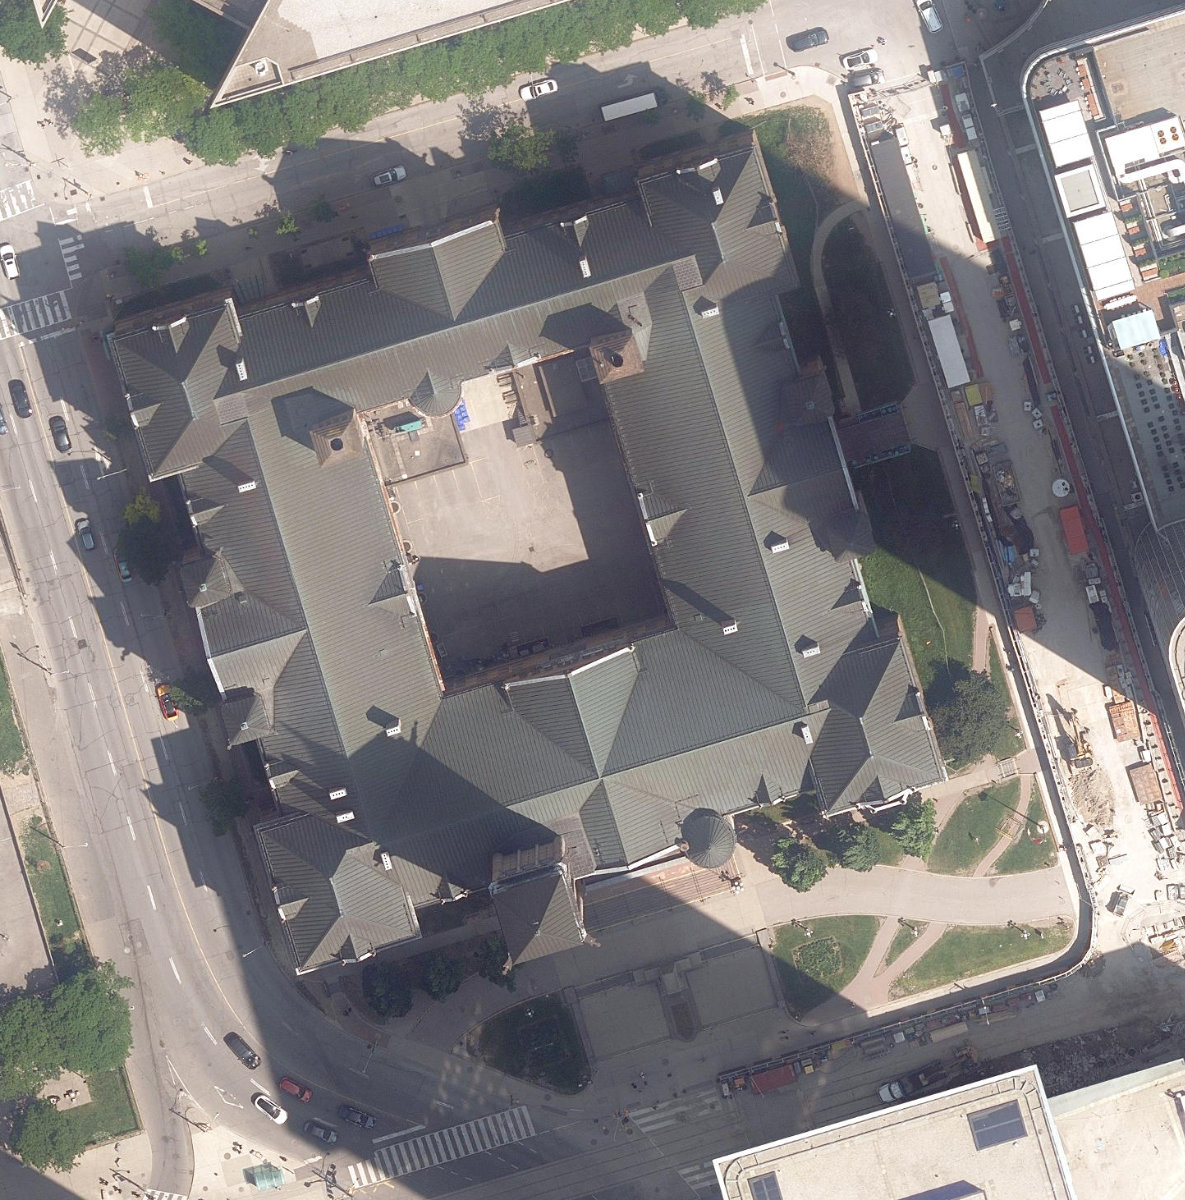
Explain this score
Where did the 53 come from? Each weighted contribution against a neutral 50 baseline. Green = pushed up; red = pulled down.
Sum of contributions = the headline score. A negative bar means that dimension dragged the park below the city-wide neutral baseline.
Why this park works
OLD CITY HALL - Building Grounds works because its edge activation score (71) is one of the city's strongest and its connectivity (67) is also top quartile (its perimeter is lined with active uses).
What limits this park
OLD CITY HALL - Building Grounds is held back by natural comfort (36, below-average): only 0% canopy means little summer shade.
Most distinctive characteristic
Most distinctive feature: exceptionally high edge activation (71, top decile).
Jacobs reading
OLD CITY HALL - Building Grounds sits between an urban social park and an ecological retreat: moderately useful for both, exceptionally suited to neither.
Tradeoffs
- Connectivity (67) significantly outpaces natural comfort (36): well placed in the city but offers little shade or ecological respite.
- 19 nearby towers cast wind and shadow without contributing canopy: passive surveillance is plentiful but human-scale comfort is not.
Performance in context
- This park is a strong overperformer for its cohort: raw 53 versus an expected 39 for similar parks (medium Civic Square) (gap +14).
Typology classification
Classified as Civic Square: name flags as civic square + 85 buildings frame the edge. Secondary read: Neighbourhood Park (1.1 ha, framed by 60 mid-rise vs 19 towers).
Edge Activation
Within 100 m of the park edge: 114 active uses (restaurant, retail, cafe, transit_stop, community) and 3 dead/hostile uses (parking_lot). Active edges keep "eyes on the park" through the day; parking lots, blank institutional walls, rail and highway frontages drain street life.
Source: OSM POIs (amenity/shop) + Toronto Building Footprints + land use
Connectivity
Connectivity blends paths, intersections, transit, entrances, and edge density. This park has 0 mapped paths/walkways and 23 sidewalk segments within 50 m; 7 street intersections within 100 m; 63 transit stops within a 400 m walk; 2 estimated access points across ~419 m of perimeter. edge density is healthy, no superblock penalty. Source coverage: centreline, pedestrian_network, transit_osm.
Source: Toronto Centreline V2 + Pedestrian Network + OSM transit stops
Amenity Diversity
No amenities recorded. Score is 0 until inventory is loaded.
Source: Toronto Parks & Recreation Facilities + OSM amenity tags
Natural Comfort
Natural-comfort components for this park: ~3.7% effective canopy (0.0% from contiguous tree polygons + scattered tree density); nearest waterbody ~1329 m; 6 city-mapped trees inside the polygon (5.3/ha). Reading: exposed. Source coverage: waterbodies, street_trees. Impervious surface is approximated (Toronto's authoritative layer ships only as a raster GeoTIFF).
Source: Toronto Treed Area + Ravine + Waterbodies + Street Tree Inventory
Enclosure / Eyes on Park
85 buildings within 25 m of the park edge (60 mid-rise, 6 low-rise, 19 tower); avg edge height 36.2 m (~12 floors); 20.3 buildings per 100 m of 419 m perimeter (strong frontage density); edges lean tall but still framed; 19 towers ≥ 40 m within 25 m of the edge. "Eyes on the park" come strongest from the 60 mid-rise edge buildings.
Source: Toronto 3D Massing (building footprints + heights)
Border Vacuum Risk
Border-vacuum factors within 50 m of the park: parking_lot. Jacobs warned that highways, rail, parking lots and blank institutional edges act as "vacuums" that suppress foot traffic and isolate the park from its neighbourhood.
Source: Toronto Street Centreline (highways) + rail layer + OSM landuse + building footprints
Equity Context
Equity Context requires inputs not yet loaded for this park (Toronto Neighbourhood Profiles). Score is held at a neutral 50 with low confidence. Read with caution.
Source: Toronto Neighbourhood Profiles
Amenities (0)
No amenities recorded for this park.
Nearby active-edge features (80)
- transit stop: Albert Street0 m
- parking lot0 m
- restaurant: hot dog stand21 m
- transit stop: Queen Street West22 m
- restaurant: Duke of Richmond27 m
- restaurant: Bannock Canadian Comfort Food30 m
- restaurant: eggspectation30 m
- transit stop: Queen Street West31 m
- transit stop: Albert Street31 m
- cafe: Mieluna Cafe31 m
- retail: Style By Serkan34 m
- retail: Aerie34 m
- retail: Footaction35 m
- retail: American Eagle Outfitters37 m
- retail: Rogers39 m
- retail: Hakim Optical40 m
- retail: Bailey Neilson43 m
- retail: The Source43 m
- cafe: Tim Hortons46 m
- retail: Vivo Rosa46 m
- retail: Banana Republic47 m
- retail: Apple Store47 m
- retail: Ann Taylor48 m
- retail: OVO48 m
- retail: Maje49 m
- retail: Browns51 m
- retail: La Senza51 m
- retail: Pink52 m
- retail: Geox52 m
- retail: Aritzia56 m
- retail: Sandro57 m
- retail: Oakley58 m
- retail: Sunglass Hut58 m
- retail: Lululemon59 m
- restaurant: Freshii59 m
- restaurant: Sushi-Q59 m
- retail: Godiva Chocolatier59 m
- retail59 m
- retail: Rocky Mountain Chocolate Factory60 m
- retail: Caryl Baker Visage60 m
- retail: WirelessWave60 m
- retail: Tbooth Wireless60 m
- retail: Mrs. Fields61 m
- retail: Marc Cain64 m
- restaurant: Freshly Squeezed65 m
- cafe: Starbucks65 m
- retail: Best Buy Express65 m
- cafe: Second Cup65 m
- retail: Rogers65 m
- retail: Kiehl's65 m
- retail: Purdys Chocolatier67 m
- community: Toronto Public Library - City Hall67 m
- retail: Indigo68 m
- cafe: Starbucks68 m
- restaurant: Subway69 m
- retail: MAC Cosmetics70 m
- retail: Swatch70 m
- retail: Batteries and Gadgets73 m
- restaurant: Kernels Popcorn73 m
- restaurant: Auntie Anne's73 m
- restaurant: Refuel Juicery73 m
- retail: Le Château76 m
- retail: Harry Rosen76 m
- retail: True Religion77 m
- retail: Sephora79 m
- retail: Guess80 m
- retail: European Boutique80 m
- retail: Frank & Oak80 m
- restaurant: Teppanyaki Grill81 m
- retail: Banana Republic82 m
- retail: Williams-Sonoma82 m
- retail: Ted Baker82 m
- retail: Armani Exchange82 m
- retail: Coach83 m
- retail: Massimo Dutti83 m
- retail: Rogers83 m
- retail: Victoria Park Medispa83 m
- restaurant: Hero Certified Burgers85 m
- cafe: la prep(closed)86 m
- retail: Honey86 m
Park profile
Five-axis radar across the structural dimensions.
Citywide percentile ranks
Across all Toronto parks in the dataset.
- Overall vitality98th
- Edge activation99th
- Connectivity86th
- Amenity diversity32th
- Natural comfort25th
- Enclosure78th
Most similar parks
Closest in metric space across the five structural dimensions.
- Trinity SquareCivic Square55
- Toronto Sculpture GardenUrban Plaza52
- METROPOLITAN UNITED CHURCH GROUNDS - Building GroundsParkette51
- Prescott ParketteUrban Plaza48
- Asquith Green ParkUrban Plaza55
Most opposite parks
Furthest in metric space. Useful for recognising what kind of park this isn’t.
- Trca Lands ( 26)Ravine / Naturalized Park27
- Toronto Islands - Muggs Island ParkRavine / Naturalized Park25
- Rouge ParkRavine / Naturalized Park28
- Rouge ParkRavine / Naturalized Park26
- Rouge ParkWaterfront Park25
Visitor signals
Public attention measured by Google Places aggregates. This proxies attention, not occupancy. Aggregate-only: no usernames, no review text, no extra photos beyond the cached hero.
“Built in 1899, this Richardsonian romanesque civic building showcases a clock tower & gargoyles.” (Google editorial summary)
p93 citywide · p72 within Civic Square
Source: Google Places API · match unverified (0.00 composite confidence) · last refreshed 5/9/2026. Privacy contract. Measures public attention, not occupancy.
Human activity signals: not available
No activity signals have landed for this park yet. The model has scored its physical form but it can’t yet say how often it’s programmed, photographed, or walked through. See /data-ethics for what we will and will not collect.
Does this score feel accurate?
Your read of OLD CITY HALL - Building Groundsmatters. We’re testing whether the model lines up with how people actually use the park. Submissions are stored locally; no account needed.
Tell us how this park feels
We measure structure (canopy, edges, connectivity). You measure feeling. Both matter, and disagreement is itself useful civic data.
What would improve this park?
Generated from the weakest measured dimensions: a starting point, not a prescription.
- Diversify what people can do in the park (playground, washroom, water, shade, performance, sport, garden): even small additions raise this score.
- Increase canopy and reduce paved area. Shade and water features extend usable hours and seasons.
Data sources
- City of Toronto Open Data: Parks (Green Space)Polygon boundaries, official names, types.
- Parks & Recreation FacilitiesInventory of in-park amenities (washrooms, fields, rinks…).
- Toronto Pedestrian NetworkSidewalk segments around and through parks; estimated park entrances.
- Toronto Centreline V2Street segments + intersection nodes near park edges; trails and walkways.
- Toronto 3D MassingBuilding footprints + heights for edge-building counts, frontage density, and tower-in-the-park risk.
- Toronto Treed AreaTree canopy share inside park polygons via stratified-grid sampling.
- Toronto Waterbodies & RiversWater surface inside parks + nearest-water distance for cooling.
- Ravine & Natural Feature ProtectionRavine overlap as a cooling / natural-comfort signal.
- Toronto Street Tree InventoryTree count + density inside park polygons.
- Neighbourhood Profiles(Pending) Equity context proxy.
- OpenStreetMap (Overpass API)Cafés, restaurants, retail, transit stops, parking, highways, rail.