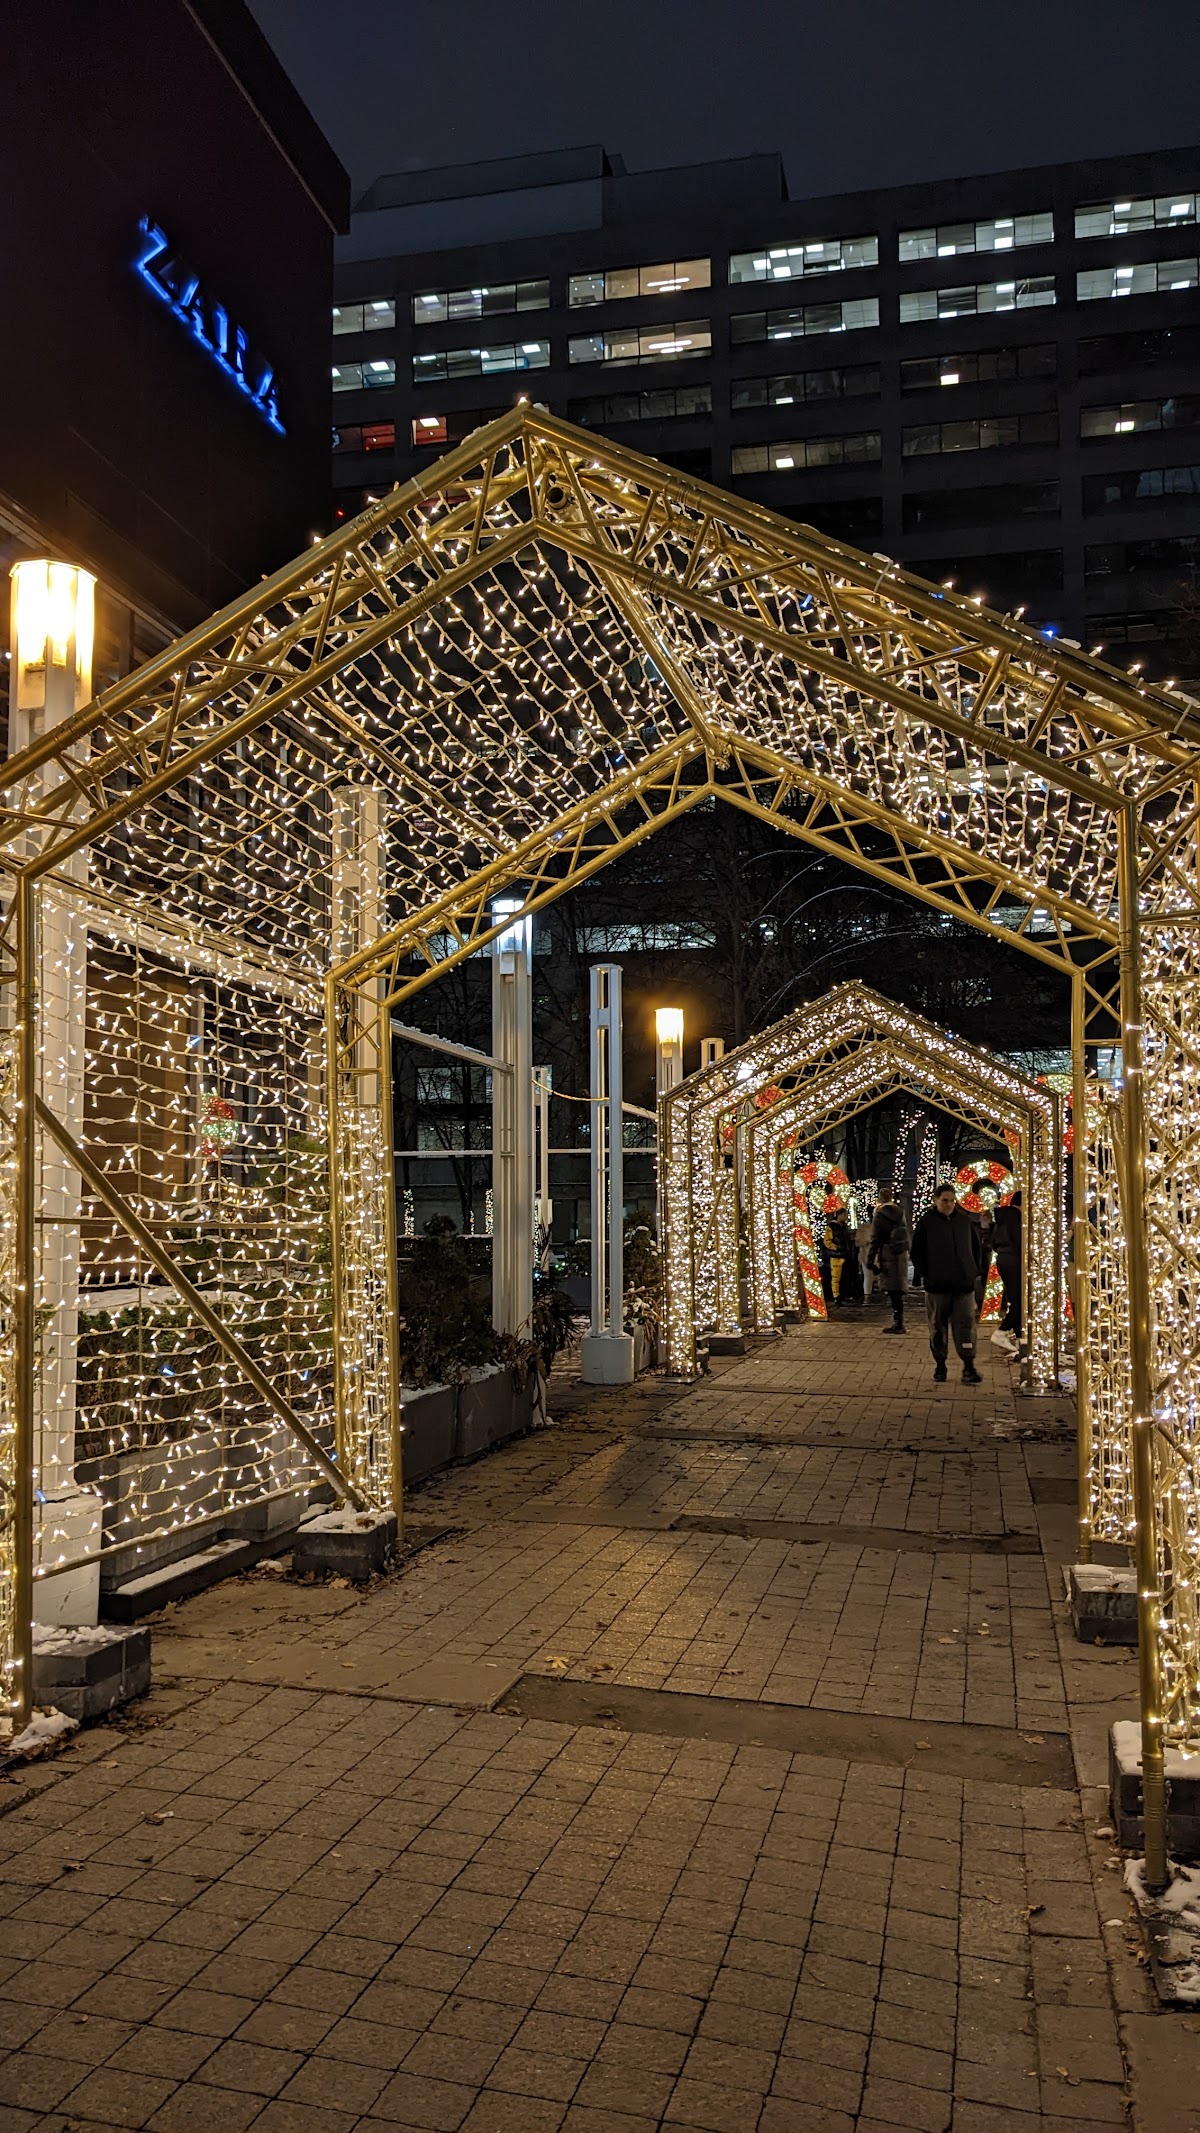
Trinity Square
Civic Square, one of the city's strongest overall (score 55, rank ~98th percentile). Strongest: edge activation; weakest: natural comfort.
Photo by Dannielle via Google Places · cached 5/9/2026
Trinity Square scores 54.6 / 100. Strongest dimensions: enclosure / eyes on park and edge activation. Weakest: amenity diversity (0). Border-vacuum risk is low. This score is a transparent reading of Jane Jacobs-style vitality factors, not a definitive judgment.
Area · 0.74 ha
Weighted across six dimensions · confidence 56%
Scores are not bell-curved. Percentiles and expected scores provide context without changing the underlying model.
Loading map…
The parks map is loading.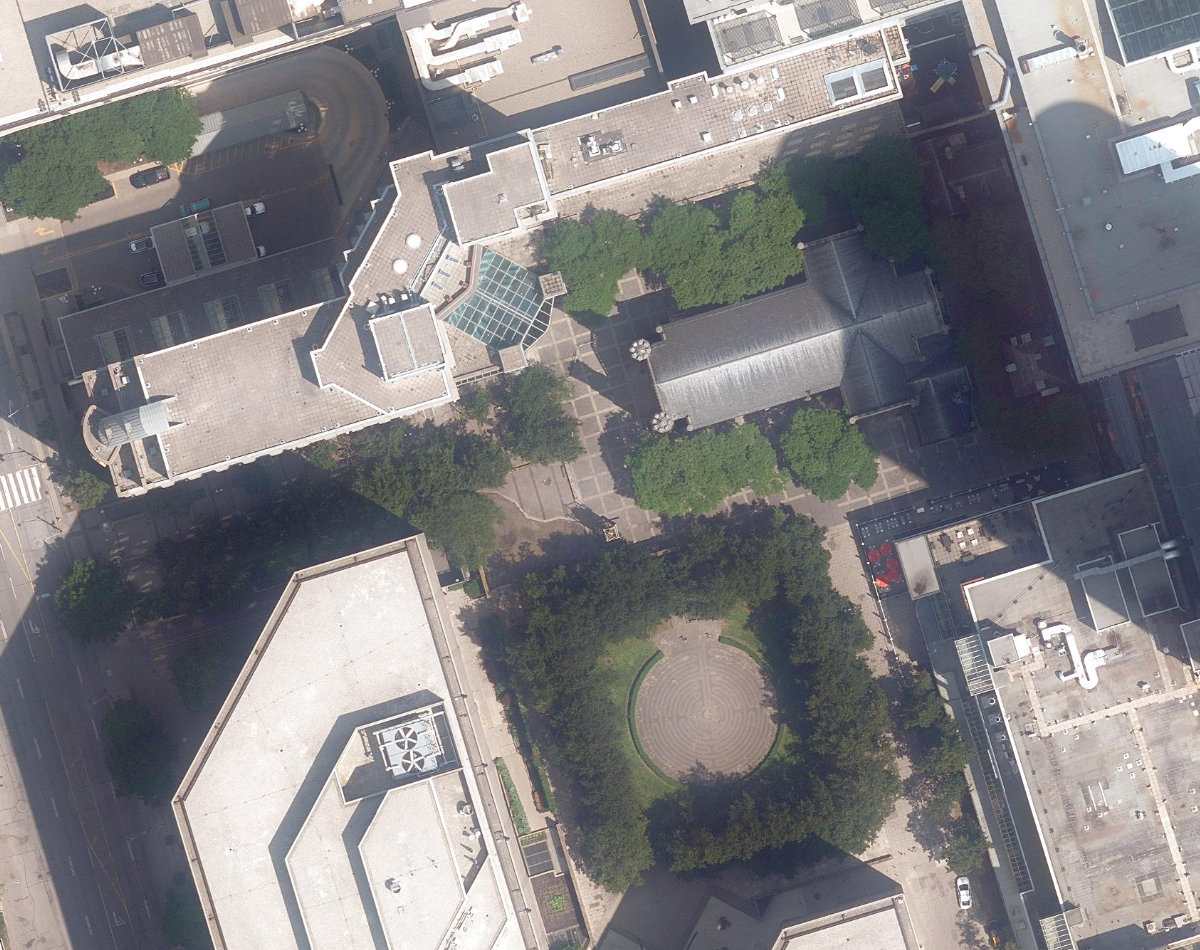
Explain this score
Where did the 55 come from? Each weighted contribution against a neutral 50 baseline. Green = pushed up; red = pulled down.
Sum of contributions = the headline score. A negative bar means that dimension dragged the park below the city-wide neutral baseline.
Why this park works
Trinity Square works because its edge activation score (73) is one of the city's strongest and its connectivity (67) is also top quartile (its perimeter is lined with active uses).
What limits this park
Trinity Square is held back by natural comfort (39, below-average): only 0% canopy means little summer shade.
Most distinctive characteristic
Most distinctive feature: exceptionally high edge activation (73, top decile).
Jacobs reading
Trinity Square sits between an urban social park and an ecological retreat: moderately useful for both, exceptionally suited to neither.
Tradeoffs
- Connectivity (67) significantly outpaces natural comfort (39): well placed in the city but offers little shade or ecological respite.
- 19 nearby towers cast wind and shadow without contributing canopy: passive surveillance is plentiful but human-scale comfort is not.
Performance in context
- This park is a strong overperformer for its cohort: raw 55 versus an expected 42 for similar parks (small Civic Square) (gap +13).
Typology classification
Classified as Civic Square: name flags as civic square + 70 buildings frame the edge
Edge Activation
Within 100 m of the park edge: 167 active uses (restaurant, retail, transit_stop, cafe) and 3 dead/hostile uses (highway, parking_lot). Active edges keep "eyes on the park" through the day; parking lots, blank institutional walls, rail and highway frontages drain street life.
Source: OSM POIs (amenity/shop) + Toronto Building Footprints + land use
Connectivity
Connectivity blends paths, intersections, transit, entrances, and edge density. This park has 0 mapped paths/walkways and 19 sidewalk segments within 50 m; 6 street intersections within 100 m; 54 transit stops within a 400 m walk; 4 estimated access points across ~491 m of perimeter. edge density is healthy, no superblock penalty. Source coverage: centreline, pedestrian_network, transit_osm.
Source: Toronto Centreline V2 + Pedestrian Network + OSM transit stops
Amenity Diversity
No amenities recorded. Score is 0 until inventory is loaded.
Source: Toronto Parks & Recreation Facilities + OSM amenity tags
Natural Comfort
Natural-comfort components for this park: ~7.0% effective canopy (0.0% from contiguous tree polygons + scattered tree density); 10 city-mapped trees inside the polygon (10.0/ha). Reading: exposed. Source coverage: street_trees. Impervious surface is approximated (Toronto's authoritative layer ships only as a raster GeoTIFF).
Source: Toronto Treed Area + Ravine + Waterbodies + Street Tree Inventory
Enclosure / Eyes on Park
70 buildings within 25 m of the park edge (48 mid-rise, 3 low-rise, 19 tower); avg edge height 36.2 m (~12 floors); 14.3 buildings per 100 m of 491 m perimeter (strong frontage density); edges lean tall but still framed; 19 towers ≥ 40 m within 25 m of the edge. "Eyes on the park" come strongest from the 48 mid-rise edge buildings.
Source: Toronto 3D Massing (building footprints + heights)
Border Vacuum Risk
Park edges face the city. No significant border vacuum detected.
Source: Toronto Street Centreline (highways) + rail layer + OSM landuse + building footprints
Equity Context
Equity Context requires inputs not yet loaded for this park (Toronto Neighbourhood Profiles). Score is held at a neutral 50 with low confidence. Read with caution.
Source: Toronto Neighbourhood Profiles
Amenities (0)
No amenities recorded for this park.
Nearby active-edge features (80)
- cafe: Trinity Square Cafe0 m
- retail: Pandora3 m
- cafe: Gong Cha3 m
- restaurant: McDonald's4 m
- restaurant: Thaï Express4 m
- restaurant: Koryo Korean BBQ5 m
- restaurant: Jimmy the Greek6 m
- retail: Lacoste6 m
- retail: Peoples Jewellers8 m
- retail: L'Occitane9 m
- retail: Bikini Village10 m
- retail: Zeiss Vision Centre10 m
- retail: claire's10 m
- retail: Sunglass Hut10 m
- retail: Abercrombie Kids10 m
- retail: Nyx11 m
- retail: L'Attitudes Salon & Spa11 m
- retail: Trade Secrets12 m
- retail: Thomas Sabo13 m
- restaurant: Trattoria Mercatto13 m
- retail: kiokii and...13 m
- retail: Pilgrim14 m
- retail: Rudsak15 m
- retail: EB Games15 m
- retail: Oak+Fort15 m
- transit stop: Hagerman Street16 m
- cafe: Starbucks17 m
- retail: Lindt19 m
- retail: Laco Sac21 m
- retail: Steve Madden21 m
- retail: Device Care24 m
- restaurant25 m
- retail: Ecco26 m
- retail: Koodo26 m
- retail: Hoka27 m
- retail: Roots27 m
- transit stop: Hagerman Street29 m
- retail: Lucky Mobile30 m
- restaurant: Bourbon St. Grill31 m
- retail: Telus31 m
- retail: Batteries and Gadgets33 m
- retail: Tumi33 m
- retail: Disney Store34 m
- retail: Garage34 m
- retail: Champs34 m
- retail: Gap34 m
- retail: Torrid35 m
- retail: L'Intervalle35 m
- retail: Zara36 m
- retail: DavidsTea36 m
- retail: BonLook36 m
- retail: B237 m
- restaurant: KFC37 m
- retail: Winners38 m
- retail: Hollister38 m
- retail: Nature Collection38 m
- retail: Virgin Plus39 m
- retail: Ever New39 m
- retail: Zumiez40 m
- retail: Rogers40 m
- retail: Bath & Body Works40 m
- retail: The Microsoft Store40 m
- retail: Freedom Mobile41 m
- retail: Treehouse Toys41 m
- retail: Aesop41 m
- restaurant: Sansotei Ramen43 m
- restaurant: Danish Pastry House43 m
- retail: Lucky Brand43 m
- retail: Journeys43 m
- restaurant: Crepe Delicious44 m
- retail: Sport Chek44 m
- retail: Eataly45 m
- retail: Eddie Bauer45 m
- restaurant: Poulet Rouge46 m
- retail: AllSaints46 m
- retail: TNA47 m
- retail: Fido47 m
- retail: La Senza48 m
- retail: Bluenotes48 m
- retail: Aveda49 m
Park profile
Five-axis radar across the structural dimensions.
Citywide percentile ranks
Across all Toronto parks in the dataset.
- Overall vitality98th
- Edge activation99th
- Connectivity85th
- Amenity diversity66th
- Natural comfort35th
- Enclosure74th
Most similar parks
Closest in metric space across the five structural dimensions.
- OLD CITY HALL - Building GroundsCivic Square53
- METROPOLITAN UNITED CHURCH GROUNDS - Building GroundsParkette51
- Toronto Sculpture GardenUrban Plaza52
- Courthouse Square ParkCivic Square52
- Prescott ParketteUrban Plaza48
Most opposite parks
Furthest in metric space. Useful for recognising what kind of park this isn’t.
- Trca Lands ( 26)Ravine / Naturalized Park27
- Toronto Islands - Muggs Island ParkRavine / Naturalized Park25
- Rouge ParkRavine / Naturalized Park28
- Rouge ParkRavine / Naturalized Park26
- Rouge ParkWaterfront Park25
Human activity signals: not available
No activity signals have landed for this park yet. The model has scored its physical form but it can’t yet say how often it’s programmed, photographed, or walked through. See /data-ethics for what we will and will not collect.
Does this score feel accurate?
Your read of Trinity Squarematters. We’re testing whether the model lines up with how people actually use the park. Submissions are stored locally; no account needed.
Tell us how this park feels
We measure structure (canopy, edges, connectivity). You measure feeling. Both matter, and disagreement is itself useful civic data.
What would improve this park?
Generated from the weakest measured dimensions: a starting point, not a prescription.
- Diversify what people can do in the park (playground, washroom, water, shade, performance, sport, garden): even small additions raise this score.
- Increase canopy and reduce paved area. Shade and water features extend usable hours and seasons.
Data sources
- City of Toronto Open Data: Parks (Green Space)Polygon boundaries, official names, types.
- Parks & Recreation FacilitiesInventory of in-park amenities (washrooms, fields, rinks…).
- Toronto Pedestrian NetworkSidewalk segments around and through parks; estimated park entrances.
- Toronto Centreline V2Street segments + intersection nodes near park edges; trails and walkways.
- Toronto 3D MassingBuilding footprints + heights for edge-building counts, frontage density, and tower-in-the-park risk.
- Toronto Treed AreaTree canopy share inside park polygons via stratified-grid sampling.
- Toronto Waterbodies & RiversWater surface inside parks + nearest-water distance for cooling.
- Ravine & Natural Feature ProtectionRavine overlap as a cooling / natural-comfort signal.
- Toronto Street Tree InventoryTree count + density inside park polygons.
- Neighbourhood Profiles(Pending) Equity context proxy.
- OpenStreetMap (Overpass API)Cafés, restaurants, retail, transit stops, parking, highways, rail.