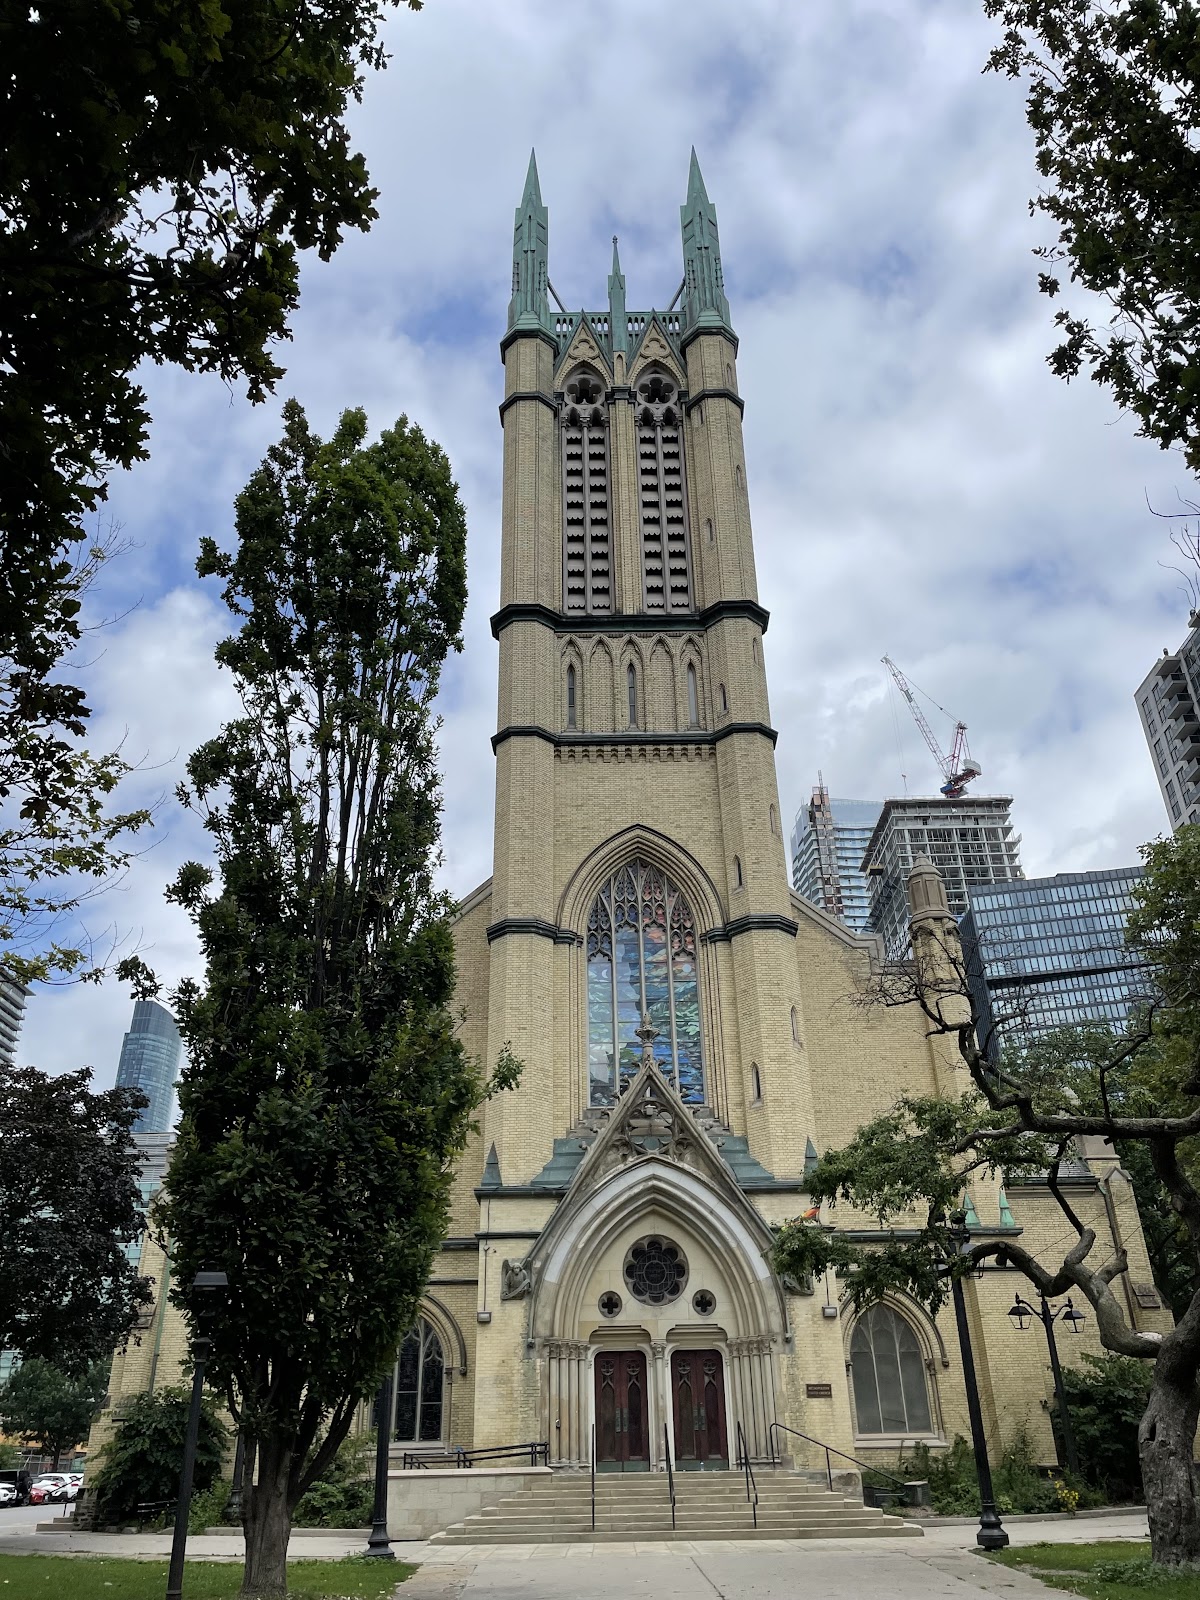
METROPOLITAN UNITED CHURCH GROUNDS - Building Grounds
Parkette, one of the city's strongest overall (score 51, rank ~96th percentile). Strongest: edge activation; weakest: natural comfort.
Photo by Karl Desjardins via Google Places · cached 5/9/2026
METROPOLITAN UNITED CHURCH GROUNDS - Building Grounds scores 51.4 / 100. Strongest dimensions: enclosure / eyes on park and edge activation. Weakest: amenity diversity (0). Border-vacuum risk is low. This score is a transparent reading of Jane Jacobs-style vitality factors, not a definitive judgment.
Area · 0.61 ha
Weighted across six dimensions · confidence 59%
Scores are not bell-curved. Percentiles and expected scores provide context without changing the underlying model.
Loading map…
The parks map is loading.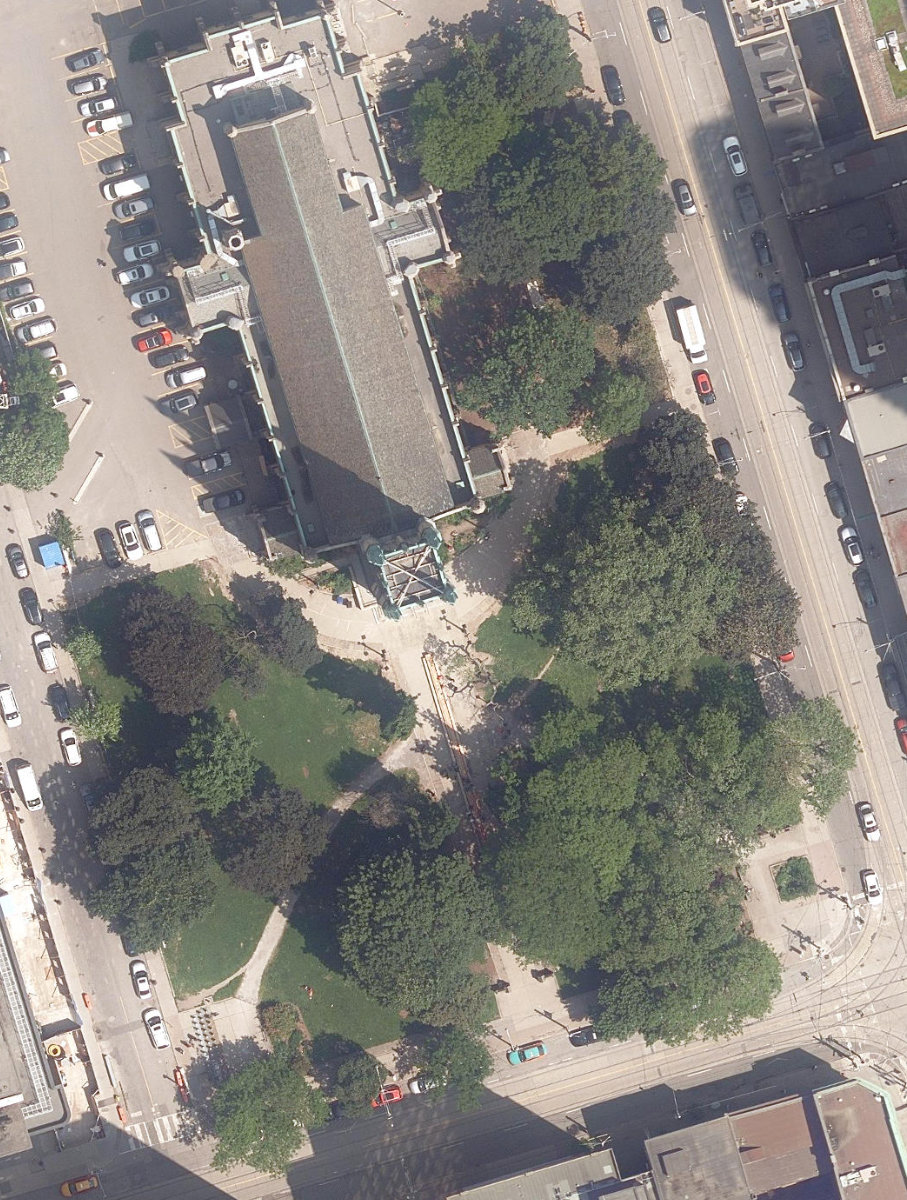
Explain this score
Where did the 51 come from? Each weighted contribution against a neutral 50 baseline. Green = pushed up; red = pulled down.
Sum of contributions = the headline score. A negative bar means that dimension dragged the park below the city-wide neutral baseline.
Why this park works
METROPOLITAN UNITED CHURCH GROUNDS - Building Grounds works because its edge activation score (67) is one of the city's strongest and its connectivity (62) is also top quartile (its perimeter is lined with active uses).
What limits this park
METROPOLITAN UNITED CHURCH GROUNDS - Building Grounds doesn't have a clear weakness. Every measured dimension is at or above the middle of the pack.
Most distinctive characteristic
Most distinctive feature: exceptionally high edge activation (67, top decile).
Jacobs reading
METROPOLITAN UNITED CHURCH GROUNDS - Building Grounds sits between an urban social park and an ecological retreat: moderately useful for both, exceptionally suited to neither.
Tradeoffs
- 44 nearby towers cast wind and shadow without contributing canopy: passive surveillance is plentiful but human-scale comfort is not.
Performance in context
- This park is a strong overperformer for its cohort: raw 51 versus an expected 36 for similar parks (small Parkette) (gap +15).
Typology classification
Classified as Parkette: small (6091 m²) with strong building frontage (30.5 per 100 m)
Edge Activation
Within 100 m of the park edge: 29 active uses (restaurant, retail, cafe, transit_stop) and 2 dead/hostile uses (parking_lot). Active edges keep "eyes on the park" through the day; parking lots, blank institutional walls, rail and highway frontages drain street life.
Source: OSM POIs (amenity/shop) + Toronto Building Footprints + land use
Connectivity
Connectivity blends paths, intersections, transit, entrances, and edge density. This park has 0 mapped paths/walkways and 18 sidewalk segments within 50 m; 12 street intersections within 100 m; 34 transit stops within a 400 m walk; 0 estimated access points across ~414 m of perimeter. edge density is healthy, no superblock penalty. Source coverage: centreline, pedestrian_network, transit_osm.
Source: Toronto Centreline V2 + Pedestrian Network + OSM transit stops
Amenity Diversity
No amenities recorded. Score is 0 until inventory is loaded.
Source: Toronto Parks & Recreation Facilities + OSM amenity tags
Natural Comfort
Natural-comfort components for this park: ~7.7% effective canopy (0.0% from contiguous tree polygons + scattered tree density); nearest waterbody ~1262 m; 11 city-mapped trees inside the polygon (11.0/ha). Reading: exposed. Source coverage: waterbodies, street_trees. Impervious surface is approximated (Toronto's authoritative layer ships only as a raster GeoTIFF).
Source: Toronto Treed Area + Ravine + Waterbodies + Street Tree Inventory
Enclosure / Eyes on Park
126 buildings within 25 m of the park edge (67 mid-rise, 15 low-rise, 44 tower); avg edge height 36.8 m (~12 floors); 30.5 buildings per 100 m of 414 m perimeter (strong frontage density); edges lean tall but still framed; 44 towers ≥ 40 m within 25 m of the edge. "Eyes on the park" come strongest from the 67 mid-rise edge buildings.
Source: Toronto 3D Massing (building footprints + heights)
Border Vacuum Risk
Border-vacuum factors within 50 m of the park: parking_lot. Jacobs warned that highways, rail, parking lots and blank institutional edges act as "vacuums" that suppress foot traffic and isolate the park from its neighbourhood.
Source: Toronto Street Centreline (highways) + rail layer + OSM landuse + building footprints
Equity Context
Equity Context requires inputs not yet loaded for this park (Toronto Neighbourhood Profiles). Score is held at a neutral 50 with low confidence. Read with caution.
Source: Toronto Neighbourhood Profiles
Amenities (0)
No amenities recorded for this park.
Nearby active-edge features (80)
- parking lot22 m
- retail: Henry's Outlet Centre23 m
- retail: Queen's Own Bakery23 m
- retail: Crown Variety & Snack24 m
- retail: McTamney's24 m
- transit stop: Queen Street East27 m
- restaurant: McDonald's33 m
- retail: Zara Spa & Hair Studio37 m
- restaurant: Druxy's Famous Deli44 m
- transit stop: Church Street48 m
- restaurant: T.C.J. Restaurant50 m
- restaurant: Subway53 m
- cafe: Second Cup60 m
- retail: Deals 4 U62 m
- retail: Downtown Camera65 m
- retail: UnideLuxe66 m
- restaurant: A&W68 m
- retail: Jewellery Plus Pawnshop70 m
- parking lot70 m
- retail: Evershine Print & Parcel73 m
- retail77 m
- retail: Beauty & Health Spa80 m
- restaurant: Hawthorne Food & Drink82 m
- retail: Royal Dry Cleaners82 m
- restaurant: Wild Wing84 m
- restaurant: The Carbon Bar85 m
- retail: Jacob Mercari88 m
- retail: Illy95 m
- retail: Henry's96 m
- retail: No Frills97 m
- retail: AAA Diamonds100 m
- cafe: Tim Hortons103 m
- restaurant: McVeigh's105 m
- restaurant: Makilala110 m
- cafe: Mast Coffee112 m
- parking lot116 m
- restaurant: Domino's119 m
- restaurant: Bob's Bulgogi121 m
- retail: Friends Convenience & Grocery125 m
- restaurant: Lighthouse Shisha Lounge129 m
- restaurant: Booster Juice137 m
- retail: Rabba140 m
- cafe: Starbucks140 m
- restaurant: La Bettola Di Terroni145 m
- restaurant: Subway151 m
- retail: International News154 m
- retail: Gateway Newsstands154 m
- retail155 m
- retail: Urban Philosophy158 m
- retail: Sweetgrass160 m
- transit stop: Entrance by 2 Queen Street East164 m
- parking lot165 m
- restaurant: Batch166 m
- cafe: Starbucks167 m
- restaurant: Subway168 m
- restaurant: Portico169 m
- retail: Parsian Fine Foods171 m
- retail: Zeglio Custom Clothiers171 m
- restaurant: Fran's Restaurant175 m
- parking lot177 m
- retail: A & E Optical179 m
- retail: Addition Elle180 m
- restaurant: Salus181 m
- retail: Panemor181 m
- community: Toronto Met Catholics182 m
- cafe: Timothy's183 m
- restaurant: Martini Bar185 m
- restaurant: Yeti Kitchen187 m
- retail: Butterfield and Robinson Travel188 m
- restaurant: Booster Juice189 m
- transit stop: Entrance from One Queen Street East (via PATH)190 m
- retail: My Legacy Cannabis190 m
- retail: Ben McNally192 m
- retail: TireSource193 m
- transit stop: Yonge / Queen Northeast Corner194 m
- retail: Elapra Shoes195 m
- parking lot195 m
- parking lot196 m
- restaurant: Gyu-Kaku197 m
- retail: Queen & Jarivs Vape Shop197 m
Park profile
Five-axis radar across the structural dimensions.
Citywide percentile ranks
Across all Toronto parks in the dataset.
- Overall vitality96th
- Edge activation99th
- Connectivity77th
- Amenity diversity44th
- Natural comfort38th
- Enclosure76th
Most similar parks
Closest in metric space across the five structural dimensions.
- Toronto Sculpture GardenUrban Plaza52
- Trinity SquareCivic Square55
- OLD CITY HALL - Building GroundsCivic Square53
- Prescott ParketteUrban Plaza48
- City Wide Open SpaceRavine / Naturalized Park51
Most opposite parks
Furthest in metric space. Useful for recognising what kind of park this isn’t.
- Trca Lands ( 26)Ravine / Naturalized Park27
- Toronto Islands - Muggs Island ParkRavine / Naturalized Park25
- Rouge ParkRavine / Naturalized Park28
- Rouge ParkWaterfront Park25
- Rouge ParkRavine / Naturalized Park26
Visitor signals
Public attention measured by Google Places aggregates. This proxies attention, not occupancy. Aggregate-only: no usernames, no review text, no extra photos beyond the cached hero.
p69 citywide · p74 within Parkette
Source: Google Places API · match medium (0.75 composite confidence) · last refreshed 5/9/2026. Privacy contract. Measures public attention, not occupancy.
Human activity signals: not available
No activity signals have landed for this park yet. The model has scored its physical form but it can’t yet say how often it’s programmed, photographed, or walked through. See /data-ethics for what we will and will not collect.
Does this score feel accurate?
Your read of METROPOLITAN UNITED CHURCH GROUNDS - Building Groundsmatters. We’re testing whether the model lines up with how people actually use the park. Submissions are stored locally; no account needed.
Tell us how this park feels
We measure structure (canopy, edges, connectivity). You measure feeling. Both matter, and disagreement is itself useful civic data.
What would improve this park?
Generated from the weakest measured dimensions: a starting point, not a prescription.
- Diversify what people can do in the park (playground, washroom, water, shade, performance, sport, garden): even small additions raise this score.
- Increase canopy and reduce paved area. Shade and water features extend usable hours and seasons.
Data sources
- City of Toronto Open Data: Parks (Green Space)Polygon boundaries, official names, types.
- Parks & Recreation FacilitiesInventory of in-park amenities (washrooms, fields, rinks…).
- Toronto Pedestrian NetworkSidewalk segments around and through parks; estimated park entrances.
- Toronto Centreline V2Street segments + intersection nodes near park edges; trails and walkways.
- Toronto 3D MassingBuilding footprints + heights for edge-building counts, frontage density, and tower-in-the-park risk.
- Toronto Treed AreaTree canopy share inside park polygons via stratified-grid sampling.
- Toronto Waterbodies & RiversWater surface inside parks + nearest-water distance for cooling.
- Ravine & Natural Feature ProtectionRavine overlap as a cooling / natural-comfort signal.
- Toronto Street Tree InventoryTree count + density inside park polygons.
- Neighbourhood Profiles(Pending) Equity context proxy.
- OpenStreetMap (Overpass API)Cafés, restaurants, retail, transit stops, parking, highways, rail.