Prescott Parkette
Urban Plaza, in the top tier overall (score 48, rank ~93th percentile). Strongest: edge activation; weakest: natural comfort.
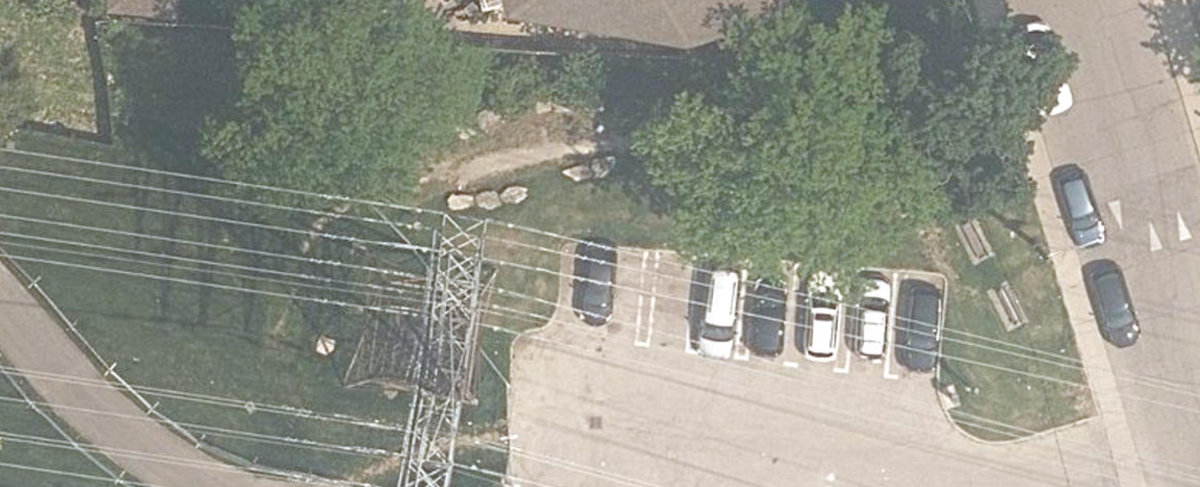
Aerial, City of Toronto orthophoto, ~8 cm/px source · cached 5/9/2026
Prescott Parkette scores 48.4 / 100. Strongest dimensions: enclosure / eyes on park and edge activation. Weakest: amenity diversity (0). Border-vacuum risk is low. This score is a transparent reading of Jane Jacobs-style vitality factors, not a definitive judgment.
Area · 0.06 ha
Weighted across six dimensions · confidence 57%
Scores are not bell-curved. Percentiles and expected scores provide context without changing the underlying model.
Loading map…
The parks map is loading.Explain this score
Where did the 48 come from? Each weighted contribution against a neutral 50 baseline. Green = pushed up; red = pulled down.
Sum of contributions = the headline score. A negative bar means that dimension dragged the park below the city-wide neutral baseline.
Why this park works
Prescott Parkette works because its edge activation score (64) is one of the city's strongest and its enclosure (76) is also top quartile (its perimeter is lined with active uses).
What limits this park
Prescott Parkette is held back by natural comfort (33, bottom quartile): only 0% canopy means little summer shade.
Most distinctive characteristic
Most distinctive feature: exceptionally high edge activation (64, top decile).
Jacobs reading
Prescott Parkette sits between an urban social park and an ecological retreat: moderately useful for both, exceptionally suited to neither.
Tradeoffs
- Connectivity (61) significantly outpaces natural comfort (33): well placed in the city but offers little shade or ecological respite.
Performance in context
- This park is a strong overperformer for its cohort: raw 48 versus an expected 36 for similar parks (pocket Urban Plaza) (gap +12).
Typology classification
Classified as Urban Plaza: 564 m², paved (0% canopy), 36.8 buildings/100 m
Edge Activation
Within 100 m of the park edge: 24 active uses (retail, transit_stop, cafe, restaurant) and 2 dead/hostile uses (parking_lot). Active edges keep "eyes on the park" through the day; parking lots, blank institutional walls, rail and highway frontages drain street life.
Source: OSM POIs (amenity/shop) + Toronto Building Footprints + land use
Connectivity
Connectivity blends paths, intersections, transit, entrances, and edge density. This park has 6 mapped paths/walkways and 18 sidewalk segments within 50 m; 16 street intersections within 100 m; 10 transit stops within a 400 m walk; 0 estimated access points across ~147 m of perimeter. edge density is healthy, no superblock penalty. Source coverage: centreline, pedestrian_network, transit_osm.
Source: Toronto Centreline V2 + Pedestrian Network + OSM transit stops
Amenity Diversity
No amenities recorded. Score is 0 until inventory is loaded.
Source: Toronto Parks & Recreation Facilities + OSM amenity tags
Natural Comfort
Natural-comfort components for this park: ~1.4% effective canopy (0.0% from contiguous tree polygons + scattered tree density); nearest waterbody ~1250 m; 2 city-mapped trees inside the polygon (2.0/ha). Reading: exposed. Source coverage: waterbodies, street_trees. Impervious surface is approximated (Toronto's authoritative layer ships only as a raster GeoTIFF).
Source: Toronto Treed Area + Ravine + Waterbodies + Street Tree Inventory
Enclosure / Eyes on Park
54 buildings within 25 m of the park edge (2 mid-rise, 52 low-rise, 0 tower); avg edge height 6.4 m (~2 floors); 36.8 buildings per 100 m of 147 m perimeter (strong frontage density); edges are low-rise (mostly 2 to 3 floors); no towers immediately adjacent. "Eyes on the park" come strongest from the 2 mid-rise edge buildings.
Source: Toronto 3D Massing (building footprints + heights)
Border Vacuum Risk
Border-vacuum factors within 50 m of the park: Carpark 133, parking_lot. Jacobs warned that highways, rail, parking lots and blank institutional edges act as "vacuums" that suppress foot traffic and isolate the park from its neighbourhood.
Source: Toronto Street Centreline (highways) + rail layer + OSM landuse + building footprints
Equity Context
Equity Context requires inputs not yet loaded for this park (Toronto Neighbourhood Profiles). Score is held at a neutral 50 with low confidence. Read with caution.
Source: Toronto Neighbourhood Profiles
Amenities (0)
No amenities recorded for this park.
Nearby active-edge features (41)
- parking lot: Carpark 1338 m
- parking lot26 m
- restaurant: Samba32 m
- retail: Lucky Star Flowers32 m
- retail: Boston Variety37 m
- restaurant: Flor do Ave39 m
- retail: St. Clair Bakery41 m
- restaurant: El Rancherito46 m
- transit stop: Laughton51 m
- cafe: Aunty Em's Deli & Coffee60 m
- retail: Sandro's Barber Shop69 m
- retail: West York Appliances & Furniture70 m
- retail: Art Collective CODA70 m
- retail: City Nails71 m
- retail: Dollar & Variety Store71 m
- retail: Golden Star72 m
- transit stop: Laughton74 m
- restaurant: Unique Cafe Restaurant74 m
- restaurant: Sabors Tradicionais79 m
- cafe: Lido Caffe81 m
- retail: Librarie Mosaique83 m
- retail: Bad Buddha Tattoes83 m
- retail: Sister's Choice85 m
- restaurant: Marina’s Casa da Comida88 m
- restaurant: Távora90 m
- restaurant: Da Silva Sports Bar & Grill99 m
- parking lot100 m
- rail: Newmarket Subdivision111 m
- parking lot120 m
- restaurant: Sabor Brazil139 m
- retail: Benjamin Moore144 m
- retail: Newediuk Funeral Home153 m
- restaurant: Marinho Sports Bar156 m
- retail: Hi-Five Computer162 m
- transit stop: Caledonia165 m
- transit stop: Silverthorn Avenue176 m
- restaurant: Kapital Resturant and Grill180 m
- retail: Salon Dionne180 m
- retail: Victoria Dry Cleaners184 m
- restaurant: Dairy Freeze196 m
- retail: St. Lucia Variety199 m
Park profile
Five-axis radar across the structural dimensions.
Citywide percentile ranks
Across all Toronto parks in the dataset.
- Overall vitality93th
- Edge activation99th
- Connectivity76th
- Amenity diversity40th
- Natural comfort16th
- Enclosure78th
Most similar parks
Closest in metric space across the five structural dimensions.
- METROPOLITAN UNITED CHURCH GROUNDS - Building GroundsParkette51
- Earlscourt ParkUrban Plaza51
- Toronto Sculpture GardenUrban Plaza52
- OLD CITY HALL - Building GroundsCivic Square53
- City Wide Open SpaceRavine / Naturalized Park51
Most opposite parks
Furthest in metric space. Useful for recognising what kind of park this isn’t.
- Trca Lands ( 26)Ravine / Naturalized Park27
- Toronto Islands - Muggs Island ParkRavine / Naturalized Park25
- Rouge ParkRavine / Naturalized Park28
- Rouge ParkWaterfront Park25
- Rouge ParkRavine / Naturalized Park26
Human activity signals: not available
No activity signals have landed for this park yet. The model has scored its physical form but it can’t yet say how often it’s programmed, photographed, or walked through. See /data-ethics for what we will and will not collect.
Does this score feel accurate?
Your read of Prescott Parkettematters. We’re testing whether the model lines up with how people actually use the park. Submissions are stored locally; no account needed.
Tell us how this park feels
We measure structure (canopy, edges, connectivity). You measure feeling. Both matter, and disagreement is itself useful civic data.
What would improve this park?
Generated from the weakest measured dimensions: a starting point, not a prescription.
- Diversify what people can do in the park (playground, washroom, water, shade, performance, sport, garden): even small additions raise this score.
- Increase canopy and reduce paved area. Shade and water features extend usable hours and seasons.
Data sources
- City of Toronto Open Data: Parks (Green Space)Polygon boundaries, official names, types.
- Parks & Recreation FacilitiesInventory of in-park amenities (washrooms, fields, rinks…).
- Toronto Pedestrian NetworkSidewalk segments around and through parks; estimated park entrances.
- Toronto Centreline V2Street segments + intersection nodes near park edges; trails and walkways.
- Toronto 3D MassingBuilding footprints + heights for edge-building counts, frontage density, and tower-in-the-park risk.
- Toronto Treed AreaTree canopy share inside park polygons via stratified-grid sampling.
- Toronto Waterbodies & RiversWater surface inside parks + nearest-water distance for cooling.
- Ravine & Natural Feature ProtectionRavine overlap as a cooling / natural-comfort signal.
- Toronto Street Tree InventoryTree count + density inside park polygons.
- Neighbourhood Profiles(Pending) Equity context proxy.
- OpenStreetMap (Overpass API)Cafés, restaurants, retail, transit stops, parking, highways, rail.