Shaw St Traffic Median South
Corridor / Linear Park, one of the city's strongest overall (score 52, rank ~97th percentile). Strongest: edge activation; weakest: natural comfort.
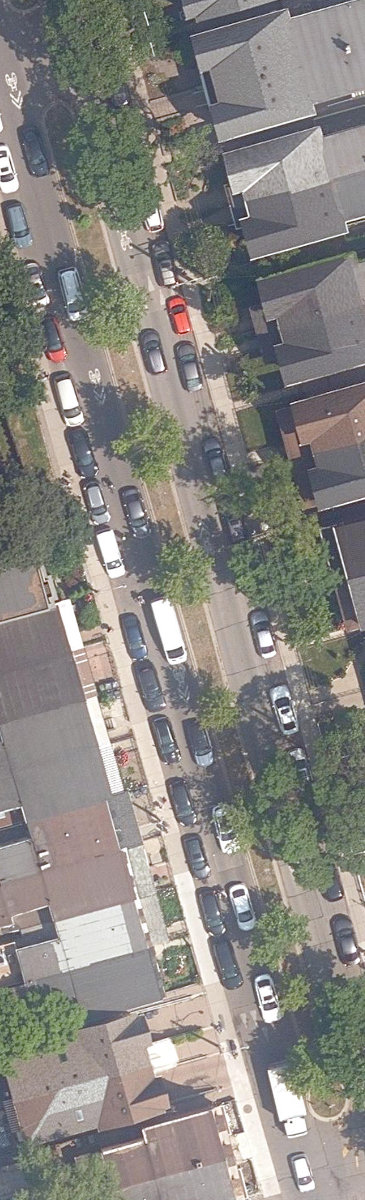
Aerial, City of Toronto orthophoto, ~8 cm/px source · cached 5/9/2026
Shaw St Traffic Median South scores 51.7 / 100. Strongest dimensions: enclosure / eyes on park and edge activation. Weakest: amenity diversity (0). Border-vacuum risk is low. This score is a transparent reading of Jane Jacobs-style vitality factors, not a definitive judgment.
Area · 0.02 ha
Weighted across six dimensions · confidence 56%
Scores are not bell-curved. Percentiles and expected scores provide context without changing the underlying model.
Loading map…
The parks map is loading.Explain this score
Where did the 52 come from? Each weighted contribution against a neutral 50 baseline. Green = pushed up; red = pulled down.
Sum of contributions = the headline score. A negative bar means that dimension dragged the park below the city-wide neutral baseline.
Why this park works
Shaw St Traffic Median South works because its edge activation score (69) is one of the city's strongest and its enclosure (83) is also top quartile (its perimeter is lined with active uses).
What limits this park
Shaw St Traffic Median South is held back by natural comfort (36, below-average): only 0% canopy means little summer shade.
Most distinctive characteristic
Most distinctive feature: exceptionally high edge activation (69, top decile).
Jacobs reading
Shaw St Traffic Median South sits between an urban social park and an ecological retreat: moderately useful for both, exceptionally suited to neither.
Performance in context
- This park is a strong overperformer for its cohort: raw 52 versus an expected 32 for similar parks (pocket Corridor / Linear Park) (gap +20).
Typology classification
Classified as Corridor / Linear Park: shape elongation 3.9× a circle of equal area. Secondary read: Urban Plaza (207 m², paved (0% canopy), 28.4 buildings/100 m).
Edge Activation
Within 100 m of the park edge: 20 active uses (retail, restaurant, cafe, transit_stop) and 1 dead/hostile uses (parking_lot). Active edges keep "eyes on the park" through the day; parking lots, blank institutional walls, rail and highway frontages drain street life.
Source: OSM POIs (amenity/shop) + Toronto Building Footprints + land use
Connectivity
Connectivity blends paths, intersections, transit, entrances, and edge density. This park has 0 mapped paths/walkways and 12 sidewalk segments within 50 m; 8 street intersections within 100 m; 14 transit stops within a 400 m walk; 0 estimated access points across ~201 m of perimeter. edge density is healthy, no superblock penalty. Source coverage: centreline, pedestrian_network, transit_osm.
Source: Toronto Centreline V2 + Pedestrian Network + OSM transit stops
Amenity Diversity
No amenities recorded. Score is 0 until inventory is loaded.
Source: Toronto Parks & Recreation Facilities + OSM amenity tags
Natural Comfort
Natural-comfort components for this park: ~4.2% effective canopy (0.0% from contiguous tree polygons + scattered tree density); 6 city-mapped trees inside the polygon (6.0/ha). Reading: exposed. Source coverage: street_trees. Impervious surface is approximated (Toronto's authoritative layer ships only as a raster GeoTIFF).
Source: Toronto Treed Area + Ravine + Waterbodies + Street Tree Inventory
Enclosure / Eyes on Park
57 buildings within 25 m of the park edge (8 mid-rise, 49 low-rise, 0 tower); avg edge height 7.4 m (~2 floors); 28.4 buildings per 100 m of 201 m perimeter (strong frontage density); edges are low-rise (mostly 2 to 3 floors); no towers immediately adjacent. "Eyes on the park" come strongest from the 8 mid-rise edge buildings.
Source: Toronto 3D Massing (building footprints + heights)
Border Vacuum Risk
Park edges face the city. No significant border vacuum detected.
Source: Toronto Street Centreline (highways) + rail layer + OSM landuse + building footprints
Equity Context
Equity Context requires inputs not yet loaded for this park (Toronto Neighbourhood Profiles). Score is held at a neutral 50 with low confidence. Read with caution.
Source: Toronto Neighbourhood Profiles
Amenities (0)
No amenities recorded for this park.
Nearby active-edge features (62)
- restaurant: Chadon Beni46 m
- retail48 m
- retail: Ron's Cigar Store48 m
- retail: Hanji Gifts50 m
- restaurant: AMA51 m
- restaurant: Ceniza52 m
- retail: Philistine53 m
- restaurant: Jules Bistro57 m
- transit stop: Shaw Street60 m
- restaurant: Carmen61 m
- transit stop: Shaw Street64 m
- cafe: Mercat del Carmen64 m
- retail: Sharpen66 m
- retail69 m
- retail: KNIFE71 m
- retail: Blacksmith Cycle72 m
- parking lot75 m
- transit stop: Queen Street West80 m
- transit stop: Shaw Street86 m
- retail: Rainbow Collective87 m
- retail: Foreign Rider Co92 m
- retail: Sekai Nail and Beauty Bar103 m
- cafe: Two Penny Café108 m
- cafe: Found Coffee Bellwoods113 m
- parking lot120 m
- retail123 m
- restaurant: Le Swan127 m
- retail: BYOB Cocktail Emporium130 m
- retail: Trinity Flower Cannabis132 m
- parking lot133 m
- retail: Hong Phat134 m
- retail: Tusk137 m
- retail: Show Gallery139 m
- retail: Mofer Coffee140 m
- retail: Gaspard141 m
- retail: Paul Petro144 m
- retail: Consign Toronto145 m
- retail: Stuart Jackson Gallery149 m
- retail: The Citizen Room149 m
- retail: Fawn149 m
- retail: Ratelier153 m
- retail: Aesop153 m
- retail: Locks & Mane157 m
- retail: Atomic160 m
- retail: Le Labo162 m
- restaurant: Mother166 m
- retail: 18 Waits170 m
- parking lot170 m
- restaurant: Oyster Boy171 m
- retail: Suzi Roher175 m
- restaurant: Lipstick & Dynamite176 m
- restaurant: Frankie's Diner182 m
- restaurant: Montgomery's188 m
- retail: Cooney for Hair189 m
- restaurant: Jal Jood194 m
- restaurant: The Ossington197 m
- transit stop: Ossington Avenue197 m
- retail: I Miss You197 m
- restaurant: Pastiche198 m
- retail: Reigning Champ198 m
- restaurant: Pho Tien Thanh199 m
- retail: Ollie Quinn200 m
Park profile
Five-axis radar across the structural dimensions.
Citywide percentile ranks
Across all Toronto parks in the dataset.
- Overall vitality97th
- Edge activation99th
- Connectivity62th
- Amenity diversity69th
- Natural comfort26th
- Enclosure88th
Most similar parks
Closest in metric space across the five structural dimensions.
- Lakeview Avenue ParketteUrban Plaza52
- Toronto Sculpture GardenUrban Plaza52
- Wembley ParketteUrban Plaza50
- Earlscourt ParkUrban Plaza51
- Opera PlaceUrban Plaza48
Most opposite parks
Furthest in metric space. Useful for recognising what kind of park this isn’t.
- Trca Lands ( 26)Ravine / Naturalized Park27
- Toronto Islands - Muggs Island ParkRavine / Naturalized Park25
- Rouge ParkRavine / Naturalized Park28
- Rouge ParkWaterfront Park25
- Rouge ParkRavine / Naturalized Park26
Human activity signals: not available
No activity signals have landed for this park yet. The model has scored its physical form but it can’t yet say how often it’s programmed, photographed, or walked through. See /data-ethics for what we will and will not collect.
Does this score feel accurate?
Your read of Shaw St Traffic Median Southmatters. We’re testing whether the model lines up with how people actually use the park. Submissions are stored locally; no account needed.
Tell us how this park feels
We measure structure (canopy, edges, connectivity). You measure feeling. Both matter, and disagreement is itself useful civic data.
What would improve this park?
Generated from the weakest measured dimensions: a starting point, not a prescription.
- Diversify what people can do in the park (playground, washroom, water, shade, performance, sport, garden): even small additions raise this score.
- Increase canopy and reduce paved area. Shade and water features extend usable hours and seasons.
Data sources
- City of Toronto Open Data: Parks (Green Space)Polygon boundaries, official names, types.
- Parks & Recreation FacilitiesInventory of in-park amenities (washrooms, fields, rinks…).
- Toronto Pedestrian NetworkSidewalk segments around and through parks; estimated park entrances.
- Toronto Centreline V2Street segments + intersection nodes near park edges; trails and walkways.
- Toronto 3D MassingBuilding footprints + heights for edge-building counts, frontage density, and tower-in-the-park risk.
- Toronto Treed AreaTree canopy share inside park polygons via stratified-grid sampling.
- Toronto Waterbodies & RiversWater surface inside parks + nearest-water distance for cooling.
- Ravine & Natural Feature ProtectionRavine overlap as a cooling / natural-comfort signal.
- Toronto Street Tree InventoryTree count + density inside park polygons.
- Neighbourhood Profiles(Pending) Equity context proxy.
- OpenStreetMap (Overpass API)Cafés, restaurants, retail, transit stops, parking, highways, rail.