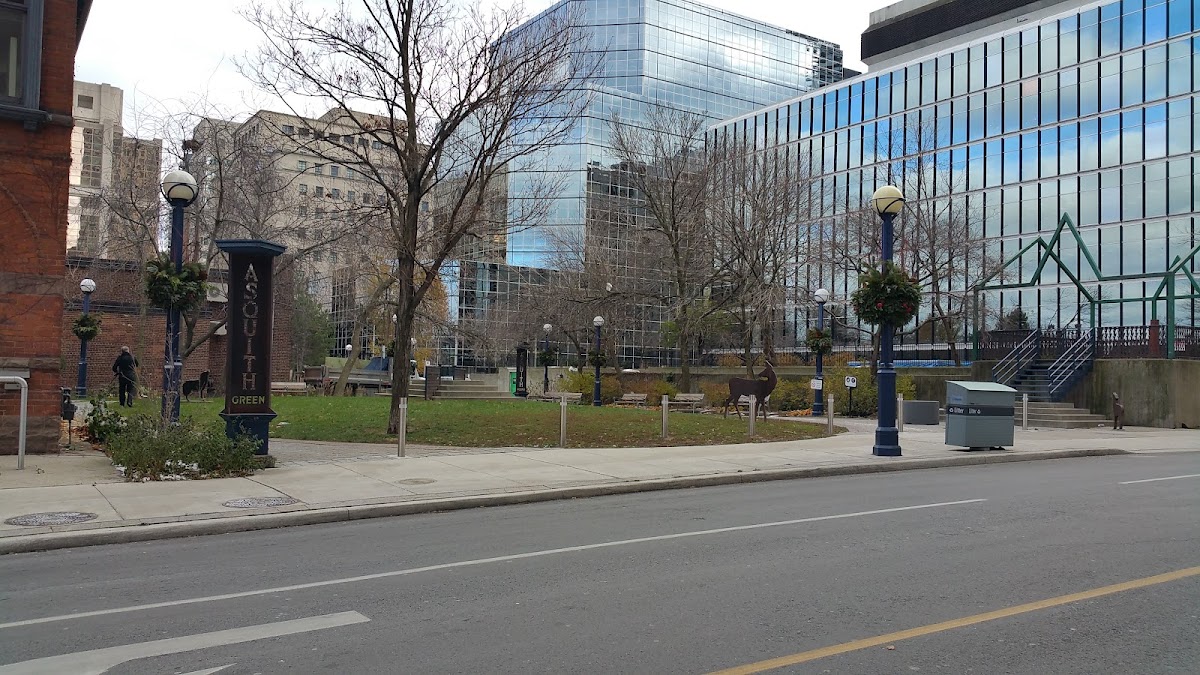
Asquith Green Park
Urban Plaza, one of the city's strongest overall (score 55, rank ~98th percentile). Strongest: edge activation; weakest: natural comfort.
Photo by ExEng via Google Places · cached 5/9/2026
Asquith Green Park scores 55.4 / 100. Strongest dimensions: enclosure / eyes on park and connectivity. Weakest: amenity diversity (0). Border-vacuum risk is low. This score is a transparent reading of Jane Jacobs-style vitality factors, not a definitive judgment.
Area · 0.09 ha
Weighted across six dimensions · confidence 57%
Scores are not bell-curved. Percentiles and expected scores provide context without changing the underlying model.
Loading map…
The parks map is loading.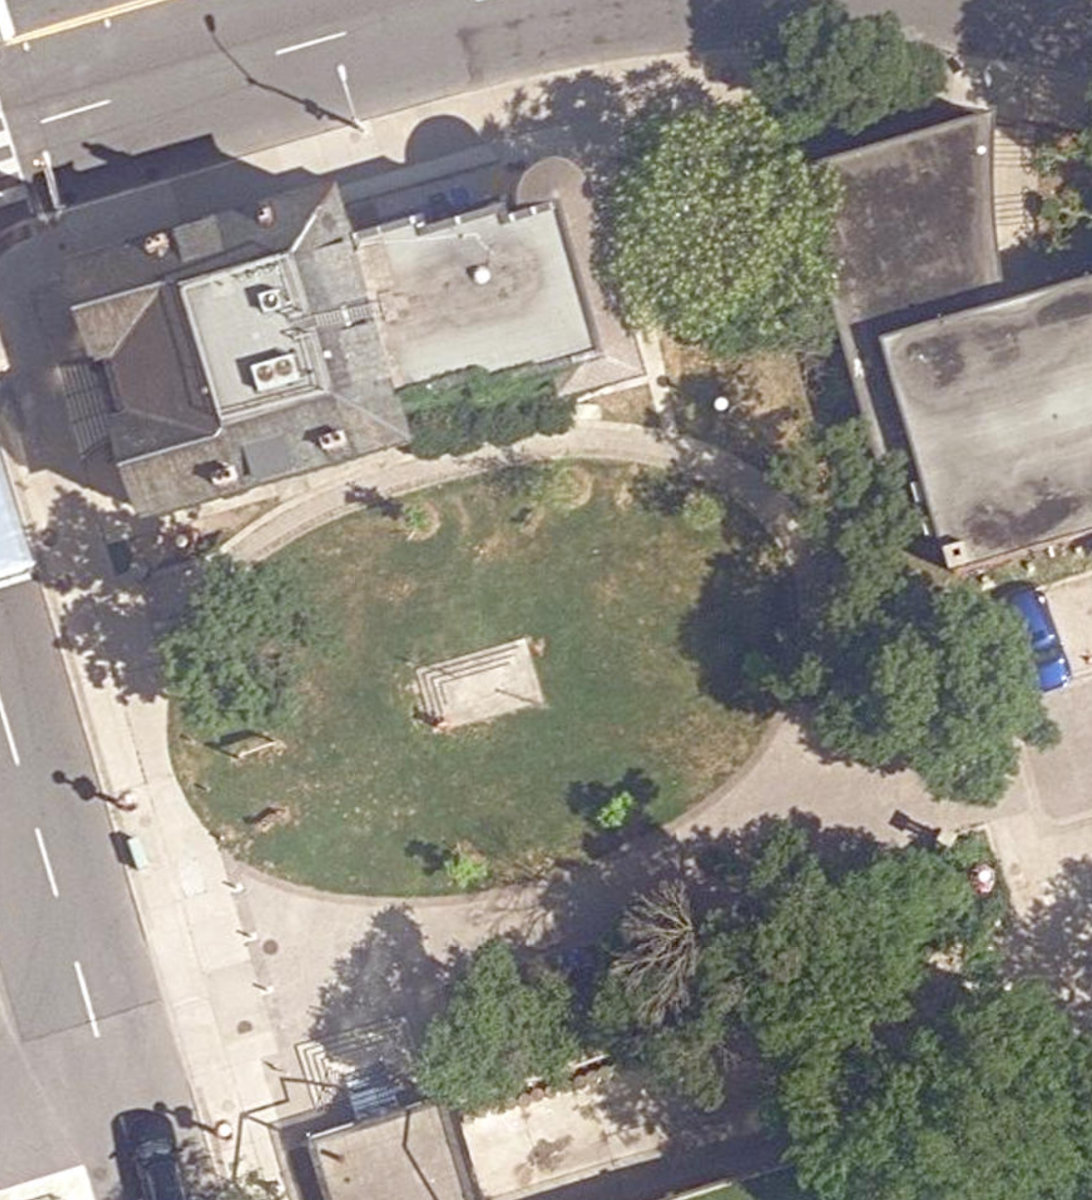
Explain this score
Where did the 55 come from? Each weighted contribution against a neutral 50 baseline. Green = pushed up; red = pulled down.
Sum of contributions = the headline score. A negative bar means that dimension dragged the park below the city-wide neutral baseline.
Why this park works
Asquith Green Park works because its edge activation score (68) is one of the city's strongest and its connectivity (77) is also top decile (its perimeter is lined with active uses).
What limits this park
Asquith Green Park is held back by natural comfort (33, bottom quartile): only 0% canopy means little summer shade.
Most distinctive characteristic
Most distinctive feature: exceptionally high edge activation (68, top decile).
Jacobs reading
Asquith Green Park sits between an urban social park and an ecological retreat: moderately useful for both, exceptionally suited to neither.
Tradeoffs
- Connectivity (77) significantly outpaces natural comfort (33): well placed in the city but offers little shade or ecological respite.
- 21 nearby towers cast wind and shadow without contributing canopy: passive surveillance is plentiful but human-scale comfort is not.
Performance in context
- This park is a strong overperformer for its cohort: raw 55 versus an expected 36 for similar parks (pocket Urban Plaza) (gap +19).
Typology classification
Classified as Urban Plaza: 900 m², paved (0% canopy), 44.8 buildings/100 m
Edge Activation
Within 100 m of the park edge: 19 active uses (restaurant, retail, cafe) and 1 dead/hostile uses (parking_lot). Active edges keep "eyes on the park" through the day; parking lots, blank institutional walls, rail and highway frontages drain street life.
Source: OSM POIs (amenity/shop) + Toronto Building Footprints + land use
Connectivity
Connectivity blends paths, intersections, transit, entrances, and edge density. This park has 7 mapped paths/walkways and 27 sidewalk segments within 50 m; 14 street intersections within 100 m; 22 transit stops within a 400 m walk; 4 estimated access points across ~141 m of perimeter. edge density is healthy, no superblock penalty. Source coverage: centreline, pedestrian_network, transit_osm.
Source: Toronto Centreline V2 + Pedestrian Network + OSM transit stops
Amenity Diversity
No amenities recorded. Score is 0 until inventory is loaded.
Source: Toronto Parks & Recreation Facilities + OSM amenity tags
Natural Comfort
Natural-comfort components for this park: 0.0% estimated tree canopy; nearest waterbody ~964 m; 1 city-mapped trees inside the polygon (1.0/ha). Reading: exposed. Source coverage: waterbodies, street_trees. Impervious surface is approximated (Toronto's authoritative layer ships only as a raster GeoTIFF).
Source: Toronto Treed Area + Ravine + Waterbodies + Street Tree Inventory
Enclosure / Eyes on Park
63 buildings within 25 m of the park edge (27 mid-rise, 15 low-rise, 21 tower); avg edge height 31.0 m (~10 floors); 44.8 buildings per 100 m of 141 m perimeter (strong frontage density); edges lean tall but still framed; 21 towers ≥ 40 m within 25 m of the edge. "Eyes on the park" come strongest from the 27 mid-rise edge buildings.
Source: Toronto 3D Massing (building footprints + heights)
Border Vacuum Risk
Park edges face the city. No significant border vacuum detected.
Source: Toronto Street Centreline (highways) + rail layer + OSM landuse + building footprints
Equity Context
Equity Context requires inputs not yet loaded for this park (Toronto Neighbourhood Profiles). Score is held at a neutral 50 with low confidence. Read with caution.
Source: Toronto Neighbourhood Profiles
Amenities (0)
No amenities recorded for this park.
Nearby active-edge features (68)
- retail: Rabba20 m
- restaurant: Villa Madina47 m
- restaurant: Thaï Express48 m
- restaurant: A&W54 m
- restaurant: Pizza Hut Express55 m
- restaurant: Subway59 m
- restaurant: Manchu Wok61 m
- retail70 m
- restaurant: Booster Juice72 m
- cafe: Tim Hortons76 m
- restaurant: The Bagel Stop76 m
- retail: INS Market77 m
- restaurant: Salad Days79 m
- restaurant: La Prep80 m
- restaurant: Sunset Grill90 m
- parking lot92 m
- restaurant: Mad Radish93 m
- restaurant: Yuzuki93 m
- cafe: Le Gourmand Café96 m
- retail: Longo's99 m
- restaurant: El Gourmet100 m
- cafe: Starbucks101 m
- rail108 m
- rail108 m
- retail: Dollarama110 m
- retail: The Printing House111 m
- highway: Bloor Street East112 m
- highway: Bloor Street East112 m
- retail: Print Pros114 m
- highway: Bloor Street East115 m
- parking lot117 m
- highway: Bloor Street East119 m
- restaurant: PI CO.120 m
- transit stop: Bloor St East Entrance126 m
- retail: LCBO129 m
- restaurant: Chipotle130 m
- highway: Bloor Street East130 m
- retail: Fido132 m
- retail: MN Nail Salon137 m
- cafe: Presse Café142 m
- highway: Bloor Street East145 m
- retail: Stylessence Fine Jewellery147 m
- highway: Bloor Street East155 m
- parking lot155 m
- cafe: Tim Hortons157 m
- transit stop: Bloor-Yonge159 m
- transit stop: Bloor-Yonge162 m
- retail: Nutrition House164 m
- highway: Bloor Street East166 m
- restaurant: Sushi Shop167 m
- transit stop: Bloor-Yonge171 m
- retail: INS Market172 m
- retail: The Eye Exam Place173 m
- restaurant: Freshii176 m
- transit stop: Bloor-Yonge177 m
- cafe: Hale Coffee178 m
- retail: LensCrafters178 m
- highway: Bloor Street East179 m
- retail: Salon Riccardo179 m
- restaurant: Cate Landwer182 m
- transit stop: 20 Bloor Street Entrance183 m
- cafe: Crema Coffee Co.184 m
- transit stop: 33 Bloor Street Entrance185 m
- restaurant: Tahini's186 m
- retail: Tucci186 m
- retail: Vivid Cleaners & Alterations187 m
- retail: Obsessions197 m
- highway: Bloor Street East199 m
Park profile
Five-axis radar across the structural dimensions.
Citywide percentile ranks
Across all Toronto parks in the dataset.
- Overall vitality98th
- Edge activation99th
- Connectivity97th
- Amenity diversity51th
- Natural comfort16th
- Enclosure84th
Most similar parks
Closest in metric space across the five structural dimensions.
- Norman Jewison ParkUrban Plaza57
- Massey Harris ParkUrban Plaza57
- OLD CITY HALL - Building GroundsCivic Square53
- James Canning GardensUrban Plaza58
- Trinity SquareCivic Square55
Most opposite parks
Furthest in metric space. Useful for recognising what kind of park this isn’t.
- Trca Lands ( 26)Ravine / Naturalized Park27
- Toronto Islands - Muggs Island ParkRavine / Naturalized Park25
- Rouge ParkRavine / Naturalized Park28
- Rouge ParkRavine / Naturalized Park26
- Rouge ParkWaterfront Park25
Visitor signals
Public attention measured by Google Places aggregates. This proxies attention, not occupancy. Aggregate-only: no usernames, no review text, no extra photos beyond the cached hero.
p44 citywide · p32 within Urban Plaza
Source: Google Places API · match unverified (0.00 composite confidence) · last refreshed 5/9/2026. Privacy contract. Measures public attention, not occupancy.
Human activity signals: not available
No activity signals have landed for this park yet. The model has scored its physical form but it can’t yet say how often it’s programmed, photographed, or walked through. See /data-ethics for what we will and will not collect.
Does this score feel accurate?
Your read of Asquith Green Parkmatters. We’re testing whether the model lines up with how people actually use the park. Submissions are stored locally; no account needed.
Tell us how this park feels
We measure structure (canopy, edges, connectivity). You measure feeling. Both matter, and disagreement is itself useful civic data.
What would improve this park?
Generated from the weakest measured dimensions: a starting point, not a prescription.
- Diversify what people can do in the park (playground, washroom, water, shade, performance, sport, garden): even small additions raise this score.
- Increase canopy and reduce paved area. Shade and water features extend usable hours and seasons.
Data sources
- City of Toronto Open Data: Parks (Green Space)Polygon boundaries, official names, types.
- Parks & Recreation FacilitiesInventory of in-park amenities (washrooms, fields, rinks…).
- Toronto Pedestrian NetworkSidewalk segments around and through parks; estimated park entrances.
- Toronto Centreline V2Street segments + intersection nodes near park edges; trails and walkways.
- Toronto 3D MassingBuilding footprints + heights for edge-building counts, frontage density, and tower-in-the-park risk.
- Toronto Treed AreaTree canopy share inside park polygons via stratified-grid sampling.
- Toronto Waterbodies & RiversWater surface inside parks + nearest-water distance for cooling.
- Ravine & Natural Feature ProtectionRavine overlap as a cooling / natural-comfort signal.
- Toronto Street Tree InventoryTree count + density inside park polygons.
- Neighbourhood Profiles(Pending) Equity context proxy.
- OpenStreetMap (Overpass API)Cafés, restaurants, retail, transit stops, parking, highways, rail.