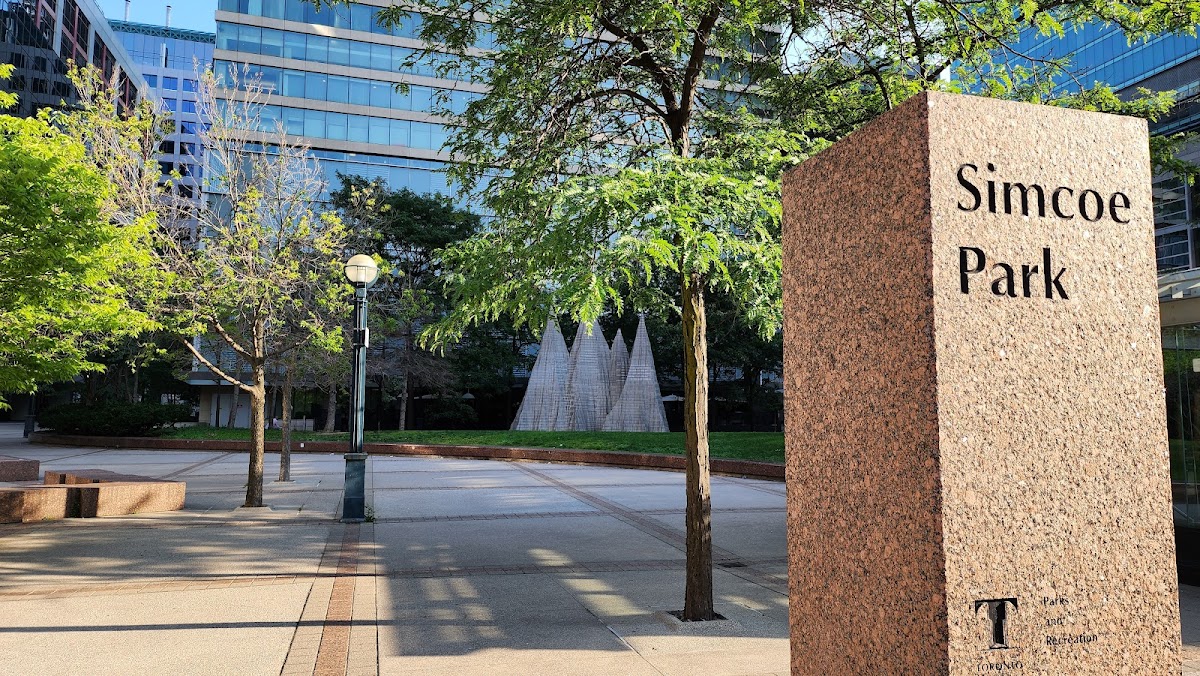
Simcoe Park
Tower-Community Green Space, one of the city's strongest overall (score 51, rank ~96th percentile). Strongest: edge activation; weakest: connectivity.
Photo by Bruce via Google Places · cached 5/9/2026
Simcoe Park scores 51.2 / 100. Strongest dimensions: edge activation and enclosure / eyes on park. Weakest: amenity diversity (0). Border-vacuum risk is low. This score is a transparent reading of Jane Jacobs-style vitality factors, not a definitive judgment.
Area · 0.39 ha
Weighted across six dimensions · confidence 59%
Scores are not bell-curved. Percentiles and expected scores provide context without changing the underlying model.
Loading map…
The parks map is loading.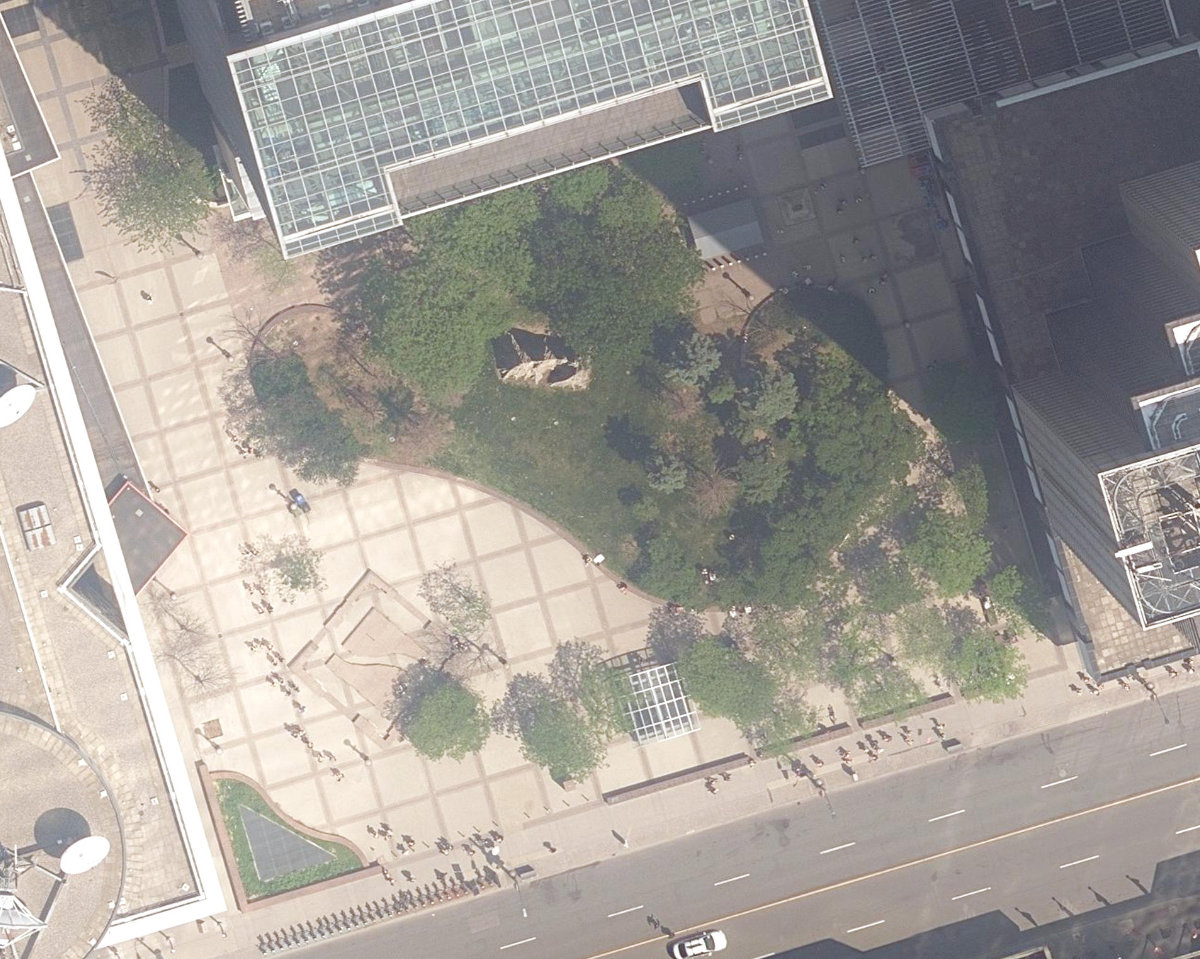
Explain this score
Where did the 51 come from? Each weighted contribution against a neutral 50 baseline. Green = pushed up; red = pulled down.
Sum of contributions = the headline score. A negative bar means that dimension dragged the park below the city-wide neutral baseline.
Why this park works
Simcoe Park works because its edge activation score (84) is one of the city's strongest and its natural comfort (53) is also above-average (its perimeter is lined with active uses).
What limits this park
Simcoe Park is held back by connectivity (32, bottom quartile).
Most distinctive characteristic
Most distinctive feature: exceptionally high edge activation (84, top decile).
Jacobs reading
Simcoe Park sits between an urban social park and an ecological retreat: moderately useful for both, exceptionally suited to neither.
Performance in context
- This park is a strong overperformer for its cohort: raw 51 versus an expected 29 for similar parks (small Tower-Community Green Space) (gap +23).
Typology classification
Classified as Tower-Community Green Space: 15 towers vs 7 mid-rise within 25 m on a 0.4 ha park. Secondary read: Civic Square (tower-walled, low canopy (0%), tight frontage: reads as a civic square).
Edge Activation
Within 100 m of the park edge: 32 active uses (cafe, restaurant, retail) and 0 dead/hostile uses (none). Active edges keep "eyes on the park" through the day; parking lots, blank institutional walls, rail and highway frontages drain street life.
Source: OSM POIs (amenity/shop) + Toronto Building Footprints + land use
Connectivity
Connectivity blends paths, intersections, transit, entrances, and edge density. This park has 0 mapped paths/walkways and 5 sidewalk segments within 50 m; 0 street intersections within 100 m; 25 transit stops within a 400 m walk; 0 estimated access points across ~259 m of perimeter. low edge density, significant superblock penalty applied. Source coverage: centreline, pedestrian_network, transit_osm.
Source: Toronto Centreline V2 + Pedestrian Network + OSM transit stops
Amenity Diversity
No amenities recorded. Score is 0 until inventory is loaded.
Source: Toronto Parks & Recreation Facilities + OSM amenity tags
Natural Comfort
Natural-comfort components for this park: ~21.7% effective canopy (0.0% from contiguous tree polygons + scattered tree density); nearest waterbody ~673 m; 31 city-mapped trees inside the polygon (31.0/ha). Reading: exposed. Source coverage: waterbodies, street_trees. Impervious surface is approximated (Toronto's authoritative layer ships only as a raster GeoTIFF).
Source: Toronto Treed Area + Ravine + Waterbodies + Street Tree Inventory
Enclosure / Eyes on Park
25 buildings within 25 m of the park edge (7 mid-rise, 3 low-rise, 15 tower); avg edge height 73.3 m (~24 floors); 9.7 buildings per 100 m of 259 m perimeter (strong frontage density); edges dominated by towers; 15 towers ≥ 40 m within 25 m of the edge. "Eyes on the park" come strongest from the 7 mid-rise edge buildings.
Source: Toronto 3D Massing (building footprints + heights)
Border Vacuum Risk
Park edges face the city. No significant border vacuum detected.
Source: Toronto Street Centreline (highways) + rail layer + OSM landuse + building footprints
Equity Context
Equity Context requires inputs not yet loaded for this park (Toronto Neighbourhood Profiles). Score is held at a neutral 50 with low confidence. Read with caution.
Source: Toronto Neighbourhood Profiles
Amenities (0)
No amenities recorded for this park.
Nearby active-edge features (80)
- cafe: Tim Hortons0 m
- retail: Marketplace0 m
- restaurant: Pumpernickel's0 m
- restaurant: Mr Souvlaki0 m
- restaurant: Amaya Express0 m
- restaurant: Green Curry Viet Thai Cuisine0 m
- restaurant: McDonald's0 m
- restaurant: Tebouli Middle Eastern Cuisine0 m
- restaurant: Manchu Wok0 m
- restaurant: Freshwest Grill0 m
- restaurant: Bourbon St. Grill0 m
- retail: International News0 m
- retail: Whole Health0 m
- restaurant: Umi Sushi Express0 m
- retail: New Tech Imaging Inc.0 m
- restaurant: Piazza Manna2 m
- restaurant: Freshly Squeezed9 m
- restaurant: Don Juan's Food Truck14 m
- restaurant: 7 Wonders Fine Foods17 m
- cafe: Starbucks32 m
- retail: New York News42 m
- restaurant: Ritz Bar62 m
- cafe: Starbucks65 m
- restaurant: The Shore Club66 m
- restaurant: Sunset Grill66 m
- cafe: Second Cup68 m
- restaurant: Azure Restaurant & Bar76 m
- restaurant: Scaddabush78 m
- cafe: Found Coffee | Front78 m
- cafe: Second Cup87 m
- retail: Sutherland-Chan Massage Therapy92 m
- restaurant: Soup Nutsy100 m
- retail: Creative Custom Framing103 m
- restaurant: Booster Juice104 m
- cafe: Tim Hortons104 m
- retail: It's A Shoe Repair106 m
- restaurant: Boston Pizza107 m
- rail: Union Station Rail Corridor114 m
- retail: Maoka117 m
- cafe: Bevy@The Combine118 m
- retail: EZ Eye Care118 m
- rail: Union Station Rail Corridor119 m
- restaurant: Harvest Green119 m
- restaurant: Pumpernickel's121 m
- parking lot: Impark121 m
- retail: Exton Dry Cleaners122 m
- rail: Union Station Rail Corridor125 m
- rail: Union Station Rail Corridor126 m
- rail: Union Station Rail Corridor127 m
- retail: Nicholby's127 m
- retail: Corporate Printing Services128 m
- restaurant: Subway129 m
- rail: Union Station Rail Corridor129 m
- rail: Union Station Rail Corridor130 m
- rail: Union Station Rail Corridor132 m
- rail: Union Station Rail Corridor134 m
- restaurant: The pint134 m
- rail: Union Station Rail Corridor135 m
- restaurant: Manchu Wok135 m
- rail: Union Station Rail Corridor137 m
- rail: Union Station Rail Corridor137 m
- rail: Union Station Rail Corridor138 m
- restaurant: Koha Pacific Kitchen139 m
- rail: Union Station Rail Corridor139 m
- rail: Union Station Rail Corridor139 m
- parking lot: Impark140 m
- rail: Union Station Rail Corridor140 m
- rail: Union Station Rail Corridor141 m
- rail: Union Station Rail Corridor141 m
- restaurant: Urban Appetite143 m
- rail: Union Station Rail Corridor143 m
- rail: Union Station Rail Corridor143 m
- restaurant: La Diperie143 m
- restaurant: South Street Burger144 m
- restaurant: Harvest Green144 m
- rail: Union Station Rail Corridor145 m
- cafe: Au Pain Doré145 m
- rail: Union Station Rail Corridor146 m
- rail: Union Station Rail Corridor147 m
- rail: Union Station Rail Corridor147 m
Park profile
Five-axis radar across the structural dimensions.
Citywide percentile ranks
Across all Toronto parks in the dataset.
- Overall vitality96th
- Edge activation100th
- Connectivity22th
- Amenity diversity48th
- Natural comfort66th
- Enclosure23th
Most similar parks
Closest in metric space across the five structural dimensions.
- David Pecaut SquareCivic Square48
- Sugar Beach ParkWaterfront Park44
- Toronto Waterfront ParkWaterfront Park43
- Queen'S Quay Traffic IslandWaterfront Park49
- Kennedy ParketteParkette47
Most opposite parks
Furthest in metric space. Useful for recognising what kind of park this isn’t.
- High ParkRavine / Naturalized Park47
- Ramsden ParkRavine / Naturalized Park43
- Withrow ParkNeighbourhood Park50
- Earlscourt ParkNeighbourhood Park44
- Christie Pits ParkRavine / Naturalized Park44
Visitor signals
Public attention measured by Google Places aggregates. This proxies attention, not occupancy. Aggregate-only: no usernames, no review text, no extra photos beyond the cached hero.
“A small park with a wading pool, playground, tables, a workers' monument & sculpture installation.” (Google editorial summary)
p80 citywide · p100 within Tower-Community Green Space
Source: Google Places API · match high (1.00 composite confidence) · last refreshed 5/9/2026. Privacy contract. Measures public attention, not occupancy.
Human activity signals: not available
No activity signals have landed for this park yet. The model has scored its physical form but it can’t yet say how often it’s programmed, photographed, or walked through. See /data-ethics for what we will and will not collect.
Does this score feel accurate?
Your read of Simcoe Parkmatters. We’re testing whether the model lines up with how people actually use the park. Submissions are stored locally; no account needed.
Tell us how this park feels
We measure structure (canopy, edges, connectivity). You measure feeling. Both matter, and disagreement is itself useful civic data.
What would improve this park?
Generated from the weakest measured dimensions: a starting point, not a prescription.
- Add or open more entrances and improve sidewalk continuity around the park. More permeability means more spontaneous use.
- Diversify what people can do in the park (playground, washroom, water, shade, performance, sport, garden): even small additions raise this score.
Data sources
- City of Toronto Open Data: Parks (Green Space)Polygon boundaries, official names, types.
- Parks & Recreation FacilitiesInventory of in-park amenities (washrooms, fields, rinks…).
- Toronto Pedestrian NetworkSidewalk segments around and through parks; estimated park entrances.
- Toronto Centreline V2Street segments + intersection nodes near park edges; trails and walkways.
- Toronto 3D MassingBuilding footprints + heights for edge-building counts, frontage density, and tower-in-the-park risk.
- Toronto Treed AreaTree canopy share inside park polygons via stratified-grid sampling.
- Toronto Waterbodies & RiversWater surface inside parks + nearest-water distance for cooling.
- Ravine & Natural Feature ProtectionRavine overlap as a cooling / natural-comfort signal.
- Toronto Street Tree InventoryTree count + density inside park polygons.
- Neighbourhood Profiles(Pending) Equity context proxy.
- OpenStreetMap (Overpass API)Cafés, restaurants, retail, transit stops, parking, highways, rail.