Toronto Waterfront Park
Waterfront Park, above average overall (score 43, rank ~84th percentile). Strongest: edge activation; weakest: amenity diversity.
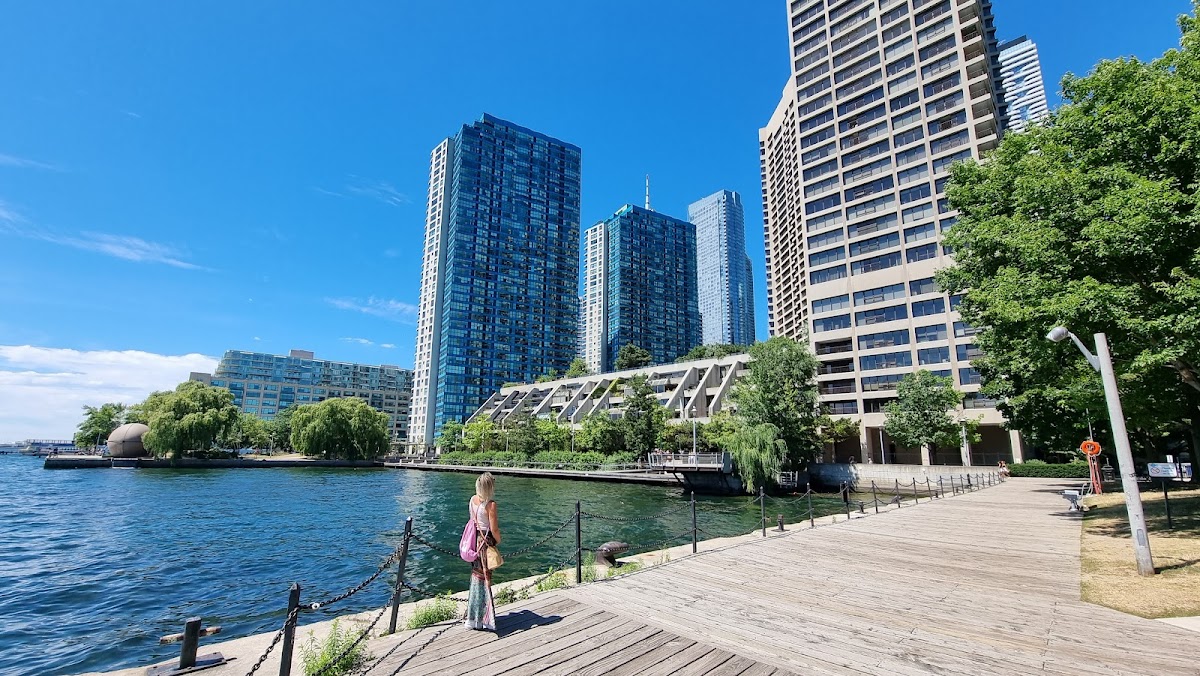
Photo by Roberto Valenti via Google Places · cached 5/9/2026
Toronto Waterfront Park scores 42.7 / 100. Strongest dimensions: edge activation and enclosure / eyes on park. Weakest: amenity diversity (0). Border-vacuum risk is low. This score is a transparent reading of Jane Jacobs-style vitality factors, not a definitive judgment.
Area · 0.17 ha
Weighted across six dimensions · confidence 57%
Scores are not bell-curved. Percentiles and expected scores provide context without changing the underlying model.
Loading map…
The parks map is loading.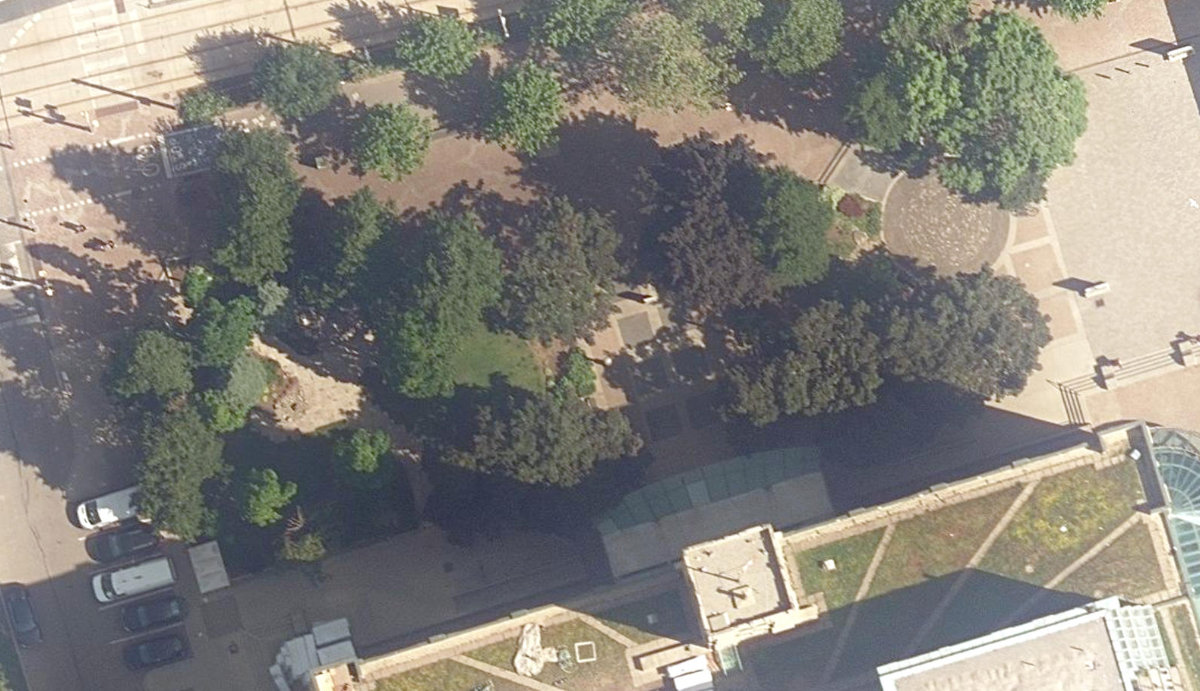
Explain this score
Where did the 43 come from? Each weighted contribution against a neutral 50 baseline. Green = pushed up; red = pulled down.
Sum of contributions = the headline score. A negative bar means that dimension dragged the park below the city-wide neutral baseline.
Why this park works
Toronto Waterfront Park works because its edge activation score (61) is one of the city's strongest (its perimeter is lined with active uses).
What limits this park
Toronto Waterfront Park is held back by amenity diversity (0, bottom quartile).
Most distinctive characteristic
Most distinctive feature: exceptionally high edge activation (61, top decile).
Jacobs reading
Toronto Waterfront Park sits between an urban social park and an ecological retreat: moderately useful for both, exceptionally suited to neither.
Tradeoffs
- 13 nearby towers cast wind and shadow without contributing canopy: passive surveillance is plentiful but human-scale comfort is not.
Performance in context
- This park is a strong overperformer for its cohort: raw 43 versus an expected 30 for similar parks (pocket Waterfront Park waterfront) (gap +13).
Typology classification
Classified as Waterfront Park: name suggests waterfront and nearest waterbody is ~59 m away. Secondary read: Tower-Community Green Space (13 towers vs 4 mid-rise within 25 m on a 0.2 ha park).
Edge Activation
Within 100 m of the park edge: 20 active uses (retail, restaurant, transit_stop, cafe) and 2 dead/hostile uses (parking_lot). Active edges keep "eyes on the park" through the day; parking lots, blank institutional walls, rail and highway frontages drain street life.
Source: OSM POIs (amenity/shop) + Toronto Building Footprints + land use
Connectivity
Connectivity blends paths, intersections, transit, entrances, and edge density. This park has 1 mapped paths/walkways and 12 sidewalk segments within 50 m; 1 street intersections within 100 m; 8 transit stops within a 400 m walk; 0 estimated access points across ~183 m of perimeter. moderate edge density, small superblock penalty applied. Source coverage: centreline, pedestrian_network, transit_osm.
Source: Toronto Centreline V2 + Pedestrian Network + OSM transit stops
Amenity Diversity
No amenities recorded. Score is 0 until inventory is loaded.
Source: Toronto Parks & Recreation Facilities + OSM amenity tags
Natural Comfort
Natural-comfort components for this park: ~3.5% effective canopy (0.0% from contiguous tree polygons + scattered tree density); nearest waterbody ~59 m; 5 city-mapped trees inside the polygon (5.0/ha). Reading: water-cooled. Source coverage: waterbodies, street_trees. Impervious surface is approximated (Toronto's authoritative layer ships only as a raster GeoTIFF).
Source: Toronto Treed Area + Ravine + Waterbodies + Street Tree Inventory
Enclosure / Eyes on Park
21 buildings within 25 m of the park edge (4 mid-rise, 4 low-rise, 13 tower); avg edge height 42.9 m (~14 floors); 11.5 buildings per 100 m of 183 m perimeter (strong frontage density); edges dominated by towers; 13 towers ≥ 40 m within 25 m of the edge. "Eyes on the park" come strongest from the 4 mid-rise edge buildings.
Source: Toronto 3D Massing (building footprints + heights)
Border Vacuum Risk
Border-vacuum factors within 50 m of the park: parking_lot, parking_lot. Jacobs warned that highways, rail, parking lots and blank institutional edges act as "vacuums" that suppress foot traffic and isolate the park from its neighbourhood.
Source: Toronto Street Centreline (highways) + rail layer + OSM landuse + building footprints
Equity Context
Equity Context requires inputs not yet loaded for this park (Toronto Neighbourhood Profiles). Score is held at a neutral 50 with low confidence. Read with caution.
Source: Toronto Neighbourhood Profiles
Amenities (0)
No amenities recorded for this park.
Nearby active-edge features (47)
- parking lot4 m
- parking lot9 m
- retail: Farm Boy13 m
- transit stop: Harbourfront Centre17 m
- retail: I Love Churros19 m
- retail: Boat Tour Tickets & Information19 m
- retail: Wine Rack25 m
- transit stop: Harbourfront Centre27 m
- restaurant: CSK37 m
- cafe: Starbucks37 m
- retail: Queen's Quay Hair Design + Esthetic38 m
- restaurant: Popeyes38 m
- retail: INS Market38 m
- restaurant: Blaze Burger38 m
- restaurant: Pizza Pizza38 m
- retail: Harbour Tours40 m
- restaurant: BeaverTails41 m
- restaurant: Shawarma West78 m
- cafe: Tim Hortons88 m
- cafe: Ivy Coffee Shop91 m
- restaurant: Dil Se Dil Tak94 m
- retail: Vape 89 Shop97 m
- restaurant: Shatter Abbas101 m
- retail: One East Hair Salon105 m
- retail: Nav’s Grocery120 m
- restaurant: Pearl Harbourfront Chinese125 m
- restaurant: Edo Japan127 m
- restaurant: Mr Souvlaki128 m
- retail: The Wine Shop133 m
- restaurant: Lakeside Local Bar & Grill135 m
- restaurant: Pie Bar135 m
- restaurant: Joe Bird136 m
- highway: Harbour Street136 m
- cafe: The Fix137 m
- cafe: Boxcar Social137 m
- retail: Bacco Market139 m
- restaurant: The Goodman Pub and Kitchen140 m
- retail: 180 Vape Store144 m
- highway: Harbour Street150 m
- retail: Golden Hanger Cleaners150 m
- highway: Harbour Street152 m
- cafe: Tim Hortons156 m
- retail: Koko Vision159 m
- restaurant: Subway165 m
- highway: York Street177 m
- retail: City Cruises by Hornblower177 m
- highway: Lake Shore Boulevard West180 m
Park profile
Five-axis radar across the structural dimensions.
Citywide percentile ranks
Across all Toronto parks in the dataset.
- Overall vitality84th
- Edge activation98th
- Connectivity36th
- Amenity diversity20th
- Natural comfort35th
- Enclosure27th
Most similar parks
Closest in metric space across the five structural dimensions.
- Kennedy ParketteParkette47
- Sugar Beach ParkWaterfront Park44
- Creekside ParkWaterfront Park48
- East Highland Creek WatercourseWaterfront Park45
- Etobicoke Hydro Green SpaceNeighbourhood Park44
Most opposite parks
Furthest in metric space. Useful for recognising what kind of park this isn’t.
- High ParkRavine / Naturalized Park47
- Ramsden ParkRavine / Naturalized Park43
- Earlscourt ParkNeighbourhood Park44
- Christie Pits ParkRavine / Naturalized Park44
- Trca Lands ( 26)Ravine / Naturalized Park27
Visitor signals
Public attention measured by Google Places aggregates. This proxies attention, not occupancy. Aggregate-only: no usernames, no review text, no extra photos beyond the cached hero.
“Grassy park with benches, shade trees, an oversize picnic table & a waterfront boardwalk.” (Google editorial summary)
p68 citywide · p68 within Waterfront Park
- match flagged for human review, confidence dampened
Source: Google Places API · match needs_review (0.39 composite confidence) · last refreshed 5/9/2026. Privacy contract. Measures public attention, not occupancy.
Human activity signals: not available
No activity signals have landed for this park yet. The model has scored its physical form but it can’t yet say how often it’s programmed, photographed, or walked through. See /data-ethics for what we will and will not collect.
Does this score feel accurate?
Your read of Toronto Waterfront Parkmatters. We’re testing whether the model lines up with how people actually use the park. Submissions are stored locally; no account needed.
Tell us how this park feels
We measure structure (canopy, edges, connectivity). You measure feeling. Both matter, and disagreement is itself useful civic data.
What would improve this park?
Generated from the weakest measured dimensions: a starting point, not a prescription.
- Add or open more entrances and improve sidewalk continuity around the park. More permeability means more spontaneous use.
- Diversify what people can do in the park (playground, washroom, water, shade, performance, sport, garden): even small additions raise this score.
- Increase canopy and reduce paved area. Shade and water features extend usable hours and seasons.
Data sources
- City of Toronto Open Data: Parks (Green Space)Polygon boundaries, official names, types.
- Parks & Recreation FacilitiesInventory of in-park amenities (washrooms, fields, rinks…).
- Toronto Pedestrian NetworkSidewalk segments around and through parks; estimated park entrances.
- Toronto Centreline V2Street segments + intersection nodes near park edges; trails and walkways.
- Toronto 3D MassingBuilding footprints + heights for edge-building counts, frontage density, and tower-in-the-park risk.
- Toronto Treed AreaTree canopy share inside park polygons via stratified-grid sampling.
- Toronto Waterbodies & RiversWater surface inside parks + nearest-water distance for cooling.
- Ravine & Natural Feature ProtectionRavine overlap as a cooling / natural-comfort signal.
- Toronto Street Tree InventoryTree count + density inside park polygons.
- Neighbourhood Profiles(Pending) Equity context proxy.
- OpenStreetMap (Overpass API)Cafés, restaurants, retail, transit stops, parking, highways, rail.