High Park
Ravine / Naturalized Park, in the top tier overall (score 47, rank ~92th percentile). Strongest: connectivity; weakest: edge activation.
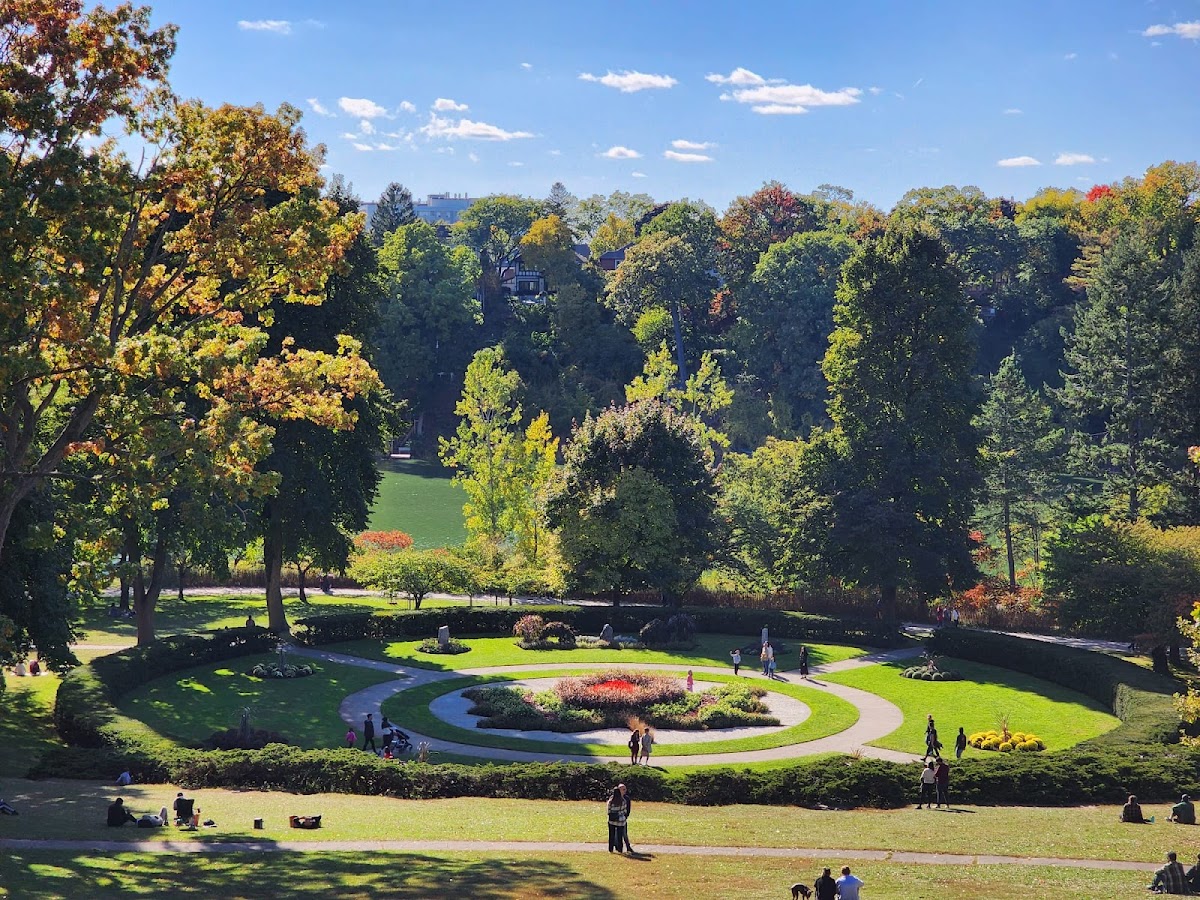
Photo by Grecia Rodriguez Alvarez via Google Places · cached 5/9/2026
High Park scores 47.2 / 100. Strongest dimensions: connectivity and enclosure / eyes on park. Weakest: edge activation (0). Border-vacuum risk is elevated (100). This score is a transparent reading of Jane Jacobs-style vitality factors, not a definitive judgment.
Area · 141.81 ha
Weighted across six dimensions · confidence 72%
Scores are not bell-curved. Percentiles and expected scores provide context without changing the underlying model.
Loading map…
The parks map is loading.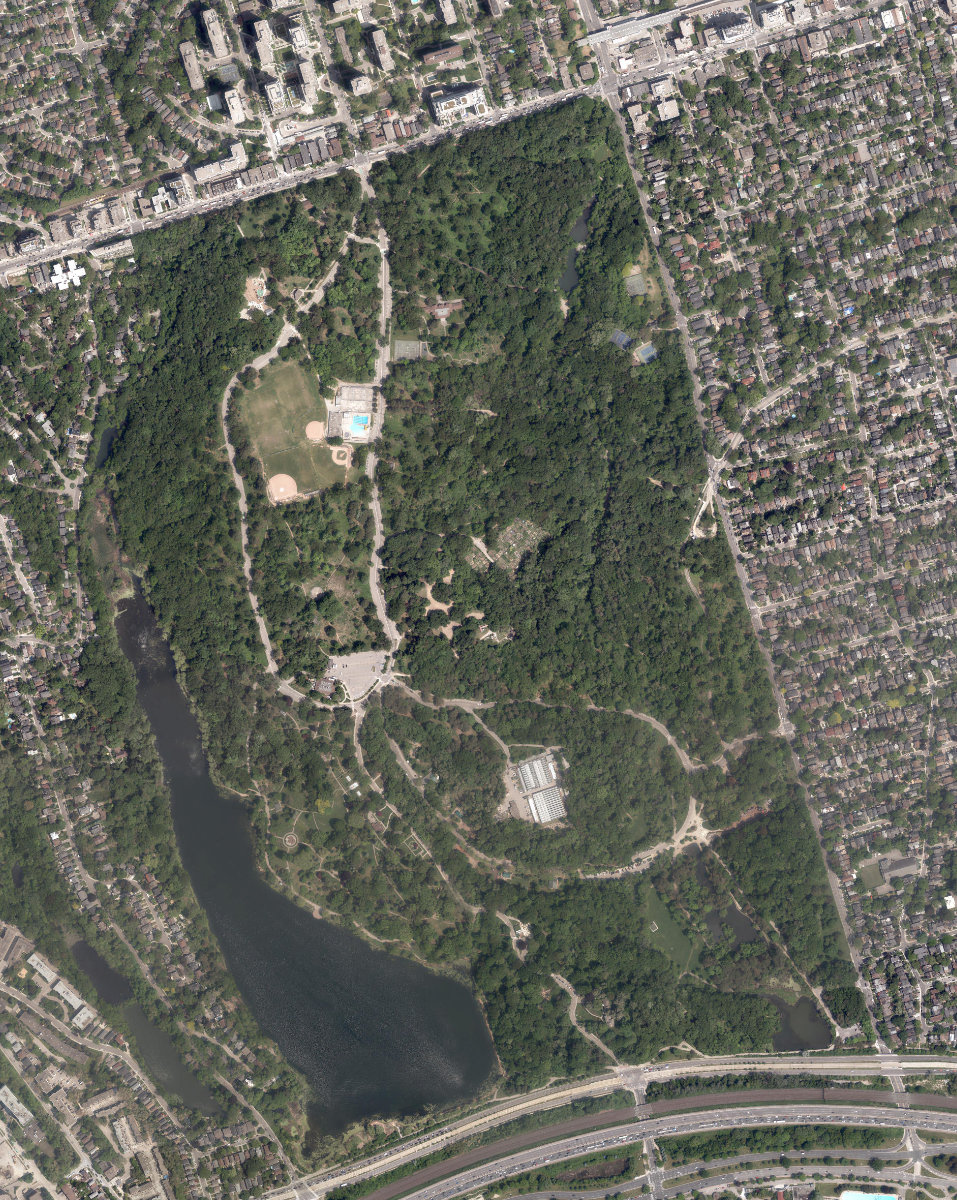
Explain this score
Where did the 47 come from? Each weighted contribution against a neutral 50 baseline. Green = pushed up; red = pulled down.
Sum of contributions = the headline score. A negative bar means that dimension dragged the park below the city-wide neutral baseline.
Why this park works
High Park works because its connectivity score (89) is one of the city's strongest and its amenity diversity (47) is also top decile (69 transit stops sit within a 400 m walk; 110 intersections fall within 100 m of the edge).
What limits this park
High Park is held back by edge activation (0, bottom quartile): the surrounding streets carry too few active uses to spill into the park; border-vacuum risk is also elevated (100).
Most distinctive characteristic
Most distinctive feature: exceptionally high connectivity (89, top decile).
Jacobs reading
High Park sits between an urban social park and an ecological retreat: moderately useful for both, exceptionally suited to neither.
Tradeoffs
- The park is enclosed by buildings (87) but the surrounding streets are quiet (edge activation 0): frame without animation.
- High connectivity coexists with high border-vacuum risk (100): much of that connectivity is to highways, rail, or parking lots, not to neighbourhoods.
- Programming score 70 (illustrative sample values, not measured) suggests this park's civic role is larger than its physical-form score (47) suggests: recurring events compensate for thinner urban-vitality conditions.
Performance in context
- This park is a strong overperformer for its cohort: raw 47 versus an expected 34 for similar parks (very large Ravine / Naturalized Park ravine) (gap +14).
Typology classification
Classified as Ravine / Naturalized Park: 100% ravine overlap, 40% canopy. Secondary read: Destination Park (142 ha, 7 amenity types, connectivity 89 / comfort 76).
Edge Activation
Within 100 m of the park edge: 74 active uses (retail, transit_stop, restaurant, cafe) and 46 dead/hostile uses (rail, highway, parking_lot). Active edges keep "eyes on the park" through the day; parking lots, blank institutional walls, rail and highway frontages drain street life.
Source: OSM POIs (amenity/shop) + Toronto Building Footprints + land use
Connectivity
Connectivity blends paths, intersections, transit, entrances, and edge density. This park has 324 mapped paths/walkways and 430 sidewalk segments within 50 m; 110 street intersections within 100 m; 69 transit stops within a 400 m walk; 43 estimated access points across ~5,683 m of perimeter. edge density is healthy, no superblock penalty. Source coverage: centreline, pedestrian_network, transit_osm.
Source: Toronto Centreline V2 + Pedestrian Network + OSM transit stops
Amenity Diversity
7 distinct amenity types in the park (dog_area, fitness, picnic, playground, sports_field, tennis, …). Diversity, not raw count, drives the score so a park with many distinct activity types can outrank a larger park that repeats the same use.
Source: Toronto Parks & Recreation Facilities + OSM amenity tags
Natural Comfort
Natural-comfort components for this park: 39.8% estimated tree canopy; 100.0% inside the ravine system; 3.4% water surface; 1258 city-mapped trees inside the polygon (8.9/ha). Reading: ravine-cooled. Source coverage: treed_area, ravine, waterbodies, street_trees. Impervious surface is approximated (Toronto's authoritative layer ships only as a raster GeoTIFF).
Source: Toronto Treed Area + Ravine + Waterbodies + Street Tree Inventory
Enclosure / Eyes on Park
542 buildings within 25 m of the park edge (181 mid-rise, 358 low-rise, 3 tower); avg edge height 10.3 m (~3 floors); 9.5 buildings per 100 m of 5,683 m perimeter (strong frontage density); edges are at a Jacobs-scale walkable mid-rise (3 to 7 floors); 3 towers ≥ 40 m within 25 m of the edge. "Eyes on the park" come strongest from the 181 mid-rise edge buildings.
Source: Toronto 3D Massing (building footprints + heights)
Border Vacuum Risk
Border-vacuum factors within 50 m of the park: Bloor Street West, Grenadier Cafe Parking Lot, parking_lot, parking_lot, parking_lot, parking_lot, Bloor Street West, parking_lot, Bloor Street West, Bloor Street West, Bloor Street West, Bloor Street West, Bloor Street West, Bloor Street West, Bloor Street West, Bloor Street West, parking_lot, parking_lot, parking_lot, parking_lot, parking_lot, Bloor Street West. Jacobs warned that highways, rail, parking lots and blank institutional edges act as "vacuums" that suppress foot traffic and isolate the park from its neighbourhood.
Source: Toronto Street Centreline (highways) + rail layer + OSM landuse + building footprints
Equity Context
Equity Context requires inputs not yet loaded for this park (Toronto Neighbourhood Profiles). Score is held at a neutral 50 with low confidence. Read with caution.
Source: Toronto Neighbourhood Profiles
Amenities (7 types · 7 records)
- dog area
- fitness
- picnic
- playground
- sports field
- tennis
- washroom
Nearby active-edge features (80)
- transit stop0 m
- transit stop: Centre Road0 m
- transit stop0 m
- parking lot: Grenadier Cafe Parking Lot0 m
- parking lot0 m
- parking lot0 m
- transit stop0 m
- transit stop0 m
- transit stop0 m
- parking lot0 m
- parking lot0 m
- transit stop: High Park Loop0 m
- transit stop: Parkside Dr at Spring Rd0 m
- transit stop: Parkside Dr at High Park Blvd0 m
- parking lot0 m
- parking lot0 m
- parking lot0 m
- transit stop: Geoffrey Street1 m
- transit stop: Parkside Dr at Howard Park Ave1 m
- transit stop: Parkside Dr at The Queensway2 m
- transit stop: Parkside Dr at Indian Valley Cres2 m
- transit stop2 m
- transit stop4 m
- transit stop6 m
- transit stop6 m
- highway: Bloor Street West14 m
- highway: Bloor Street West14 m
- highway: Bloor Street West14 m
- highway: Bloor Street West14 m
- highway: Bloor Street West14 m
- highway: Bloor Street West14 m
- highway: Bloor Street West14 m
- highway: Bloor Street West14 m
- transit stop: Parkside Dr at Howard Park Ave15 m
- transit stop: Parkside Dr at High Park Blvd15 m
- highway: Bloor Street West16 m
- transit stop: Geoffrey Street16 m
- transit stop: Parkside Dr at Algonquin Ave16 m
- transit stop: Colborne Lodge Drive16 m
- highway: Bloor Street West17 m
- transit stop: Parkside Dr at Indian Valley Cres18 m
- transit stop: Colborne Lodge Drive19 m
- transit stop23 m
- transit stop23 m
- retail: Sleep Country30 m
- restaurant: 360 Cooking Studio30 m
- cafe: Lafayette Cafe30 m
- cafe: Hannah's Cafe Bakery30 m
- restaurant: Usagi Sushi31 m
- retail: Garden Foods32 m
- transit stop: Parkside Dr at The Queensway33 m
- retail: Holdengrace34 m
- retail: Rabba34 m
- restaurant: Vivo34 m
- retail: Throw Me A Bone34 m
- restaurant: Wings Up!36 m
- retail: Global Pet Foods39 m
- transit stop: Parkside Drive39 m
- retail: Healix Medical Spa40 m
- restaurant: Lunch Box40 m
- parking lot43 m
- highway: Bloor Street West46 m
- restaurant: The Mugshot Tavern46 m
- transit stop: Parkside Drive47 m
- transit stop: Bloor Street West47 m
- parking lot48 m
- parking lot49 m
- transit stop: Parkside Drive51 m
- retail: Game Mania51 m
- transit stop: Parkside Drive51 m
- parking lot52 m
- retail: Just Us Hair Studio54 m
- restaurant: Pizza Pizza55 m
- transit stop57 m
- retail: Yan Tattoo & Piercing59 m
- highway: Bloor Street West60 m
- retail: Benito's Tacos60 m
- retail: PLUG Cannabis64 m
- rail: Oakville Subdivision70 m
- restaurant: Subway70 m
Park profile
Five-axis radar across the structural dimensions.
Citywide percentile ranks
Across all Toronto parks in the dataset.
- Overall vitality92th
- Edge activation25th
- Connectivity100th
- Amenity diversity100th
- Natural comfort88th
- Enclosure93th
Most similar parks
Closest in metric space across the five structural dimensions.
- Oriole Park - TorontoNeighbourhood Park42
- Lawrence Park RavineRavine / Naturalized Park41
- Christie Pits ParkRavine / Naturalized Park44
- Monarch ParkNeighbourhood Park45
- Rennie ParkWaterfront Park44
Most opposite parks
Furthest in metric space. Useful for recognising what kind of park this isn’t.
- Rouge ParkRavine / Naturalized Park18
- Trca Lands ( 58)Waterfront Park18
- Rouge ParkRavine / Naturalized Park21
- Queen'S Quay Traffic IslandWaterfront Park49
- Rouge ParkRavine / Naturalized Park19
Visitor signals
Public attention measured by Google Places aggregates. This proxies attention, not occupancy. Aggregate-only: no usernames, no review text, no extra photos beyond the cached hero.
“Sprawling park with hiking trails, a zoo, sports fields & a large children's playground.” (Google editorial summary)
p98 citywide · p97 within Ravine / Naturalized Park
Source: Google Places API · match high (0.98 composite confidence) · last refreshed 5/9/2026. Privacy contract. Measures public attention, not occupancy.
Human activity signals
Programming, social attention, temporal rhythm, and nearby pedestrian / cycling flow. An experimental aggregate layer that complements the spatial scores. Partial coverage, partial confidence.
Activity reading: 60 events/yr (22 recurring); 9,000 public mentions; pedestrian intensity 60/100; cycling/trail 75/100. The strongest signal is public attention / mentions. These are illustrative sample values. Calibrate before citing.
Sample data: numbers shown here are an illustrative fixture for the 10 named parks, not a measurement.
Does this score feel accurate?
Your read of High Parkmatters. We’re testing whether the model lines up with how people actually use the park. Submissions are stored locally; no account needed.
Tell us how this park feels
We measure structure (canopy, edges, connectivity). You measure feeling. Both matter, and disagreement is itself useful civic data.
What would improve this park?
Generated from the weakest measured dimensions: a starting point, not a prescription.
- Activate the edges: encourage cafés, retail or community uses on the streets that face the park; replace blank or parking-lot edges where possible.
- Diversify what people can do in the park (playground, washroom, water, shade, performance, sport, garden): even small additions raise this score.
- Mitigate border vacuums (highways, rail, parking) with active programming on the still-permeable edges and treat the hostile edge as a design challenge.
Data sources
- City of Toronto Open Data: Parks (Green Space)Polygon boundaries, official names, types.
- Parks & Recreation FacilitiesInventory of in-park amenities (washrooms, fields, rinks…).
- Toronto Pedestrian NetworkSidewalk segments around and through parks; estimated park entrances.
- Toronto Centreline V2Street segments + intersection nodes near park edges; trails and walkways.
- Toronto 3D MassingBuilding footprints + heights for edge-building counts, frontage density, and tower-in-the-park risk.
- Toronto Treed AreaTree canopy share inside park polygons via stratified-grid sampling.
- Toronto Waterbodies & RiversWater surface inside parks + nearest-water distance for cooling.
- Ravine & Natural Feature ProtectionRavine overlap as a cooling / natural-comfort signal.
- Toronto Street Tree InventoryTree count + density inside park polygons.
- Neighbourhood Profiles(Pending) Equity context proxy.
- OpenStreetMap (Overpass API)Cafés, restaurants, retail, transit stops, parking, highways, rail.