Oriole Park - Toronto
Neighbourhood Park, above average overall (score 42, rank ~81th percentile). Strongest: amenity diversity; weakest: edge activation.
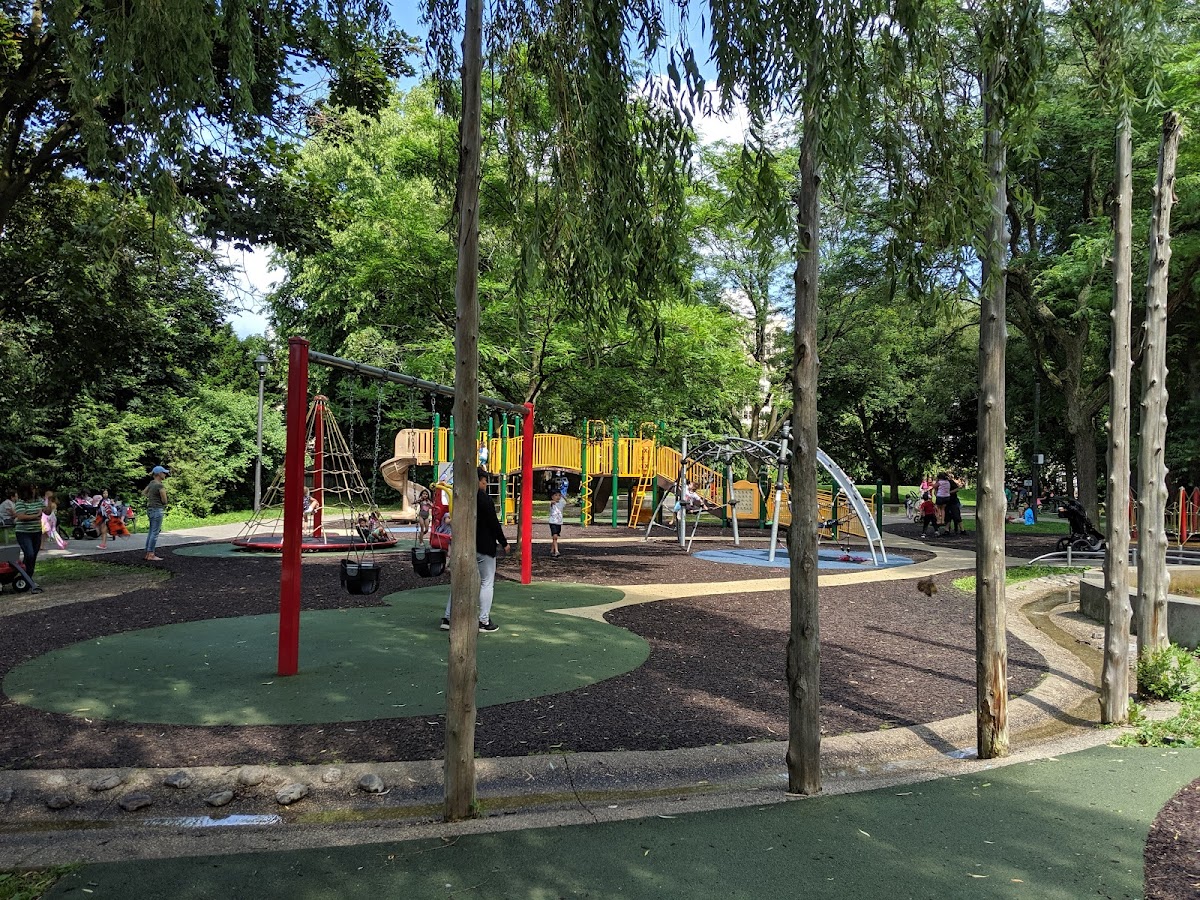
Photo by Claudia Rosu via Google Places · cached 5/9/2026
Oriole Park - Toronto scores 41.7 / 100. Strongest dimensions: enclosure / eyes on park and connectivity. Weakest: edge activation (0). Border-vacuum risk is elevated (100). This score is a transparent reading of Jane Jacobs-style vitality factors, not a definitive judgment.
Area · 2.91 ha
Weighted across six dimensions · confidence 72%
Scores are not bell-curved. Percentiles and expected scores provide context without changing the underlying model.
Loading map…
The parks map is loading.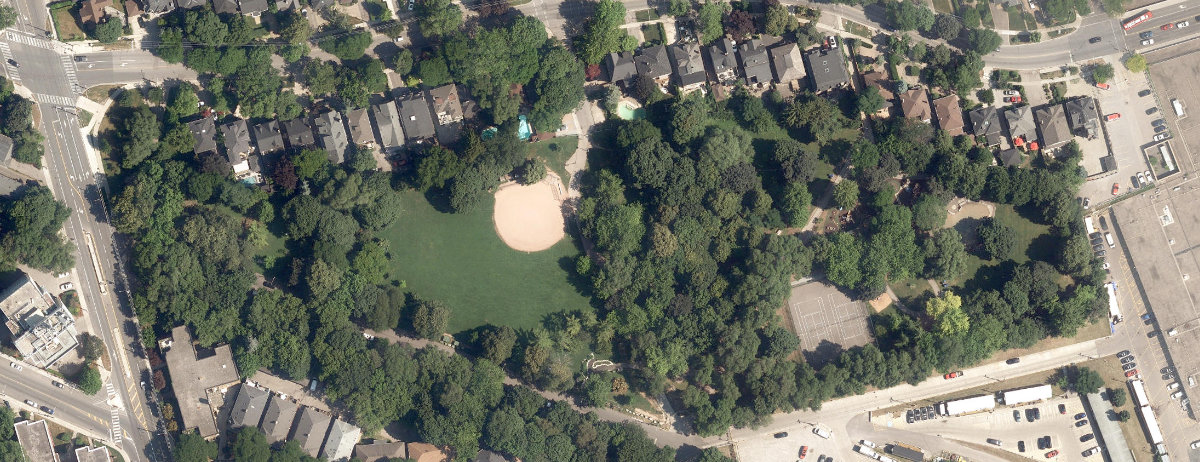
Explain this score
Where did the 42 come from? Each weighted contribution against a neutral 50 baseline. Green = pushed up; red = pulled down.
Sum of contributions = the headline score. A negative bar means that dimension dragged the park below the city-wide neutral baseline.
Why this park works
Oriole Park - Toronto works because its amenity diversity score (40) is one of the city's strongest and its connectivity (79) is also top decile.
What limits this park
Oriole Park - Toronto is held back by edge activation (0, below-average): the surrounding streets carry too few active uses to spill into the park; border-vacuum risk is also elevated (100).
Most distinctive characteristic
Most distinctive feature: exceptionally high amenity diversity (40, top decile).
Jacobs reading
Oriole Park - Toronto sits between an urban social park and an ecological retreat: moderately useful for both, exceptionally suited to neither.
Tradeoffs
- The park is enclosed by buildings (86) but the surrounding streets are quiet (edge activation 0): frame without animation.
- High connectivity coexists with high border-vacuum risk (100): much of that connectivity is to highways, rail, or parking lots, not to neighbourhoods.
Typology classification
Classified as Neighbourhood Park: 2.9 ha, framed by 19 mid-rise vs 4 towers
Edge Activation
Within 100 m of the park edge: 11 active uses (transit_stop, retail) and 17 dead/hostile uses (parking_lot, rail). Active edges keep "eyes on the park" through the day; parking lots, blank institutional walls, rail and highway frontages drain street life.
Source: OSM POIs (amenity/shop) + Toronto Building Footprints + land use
Connectivity
Connectivity blends paths, intersections, transit, entrances, and edge density. This park has 26 mapped paths/walkways and 35 sidewalk segments within 50 m; 19 street intersections within 100 m; 32 transit stops within a 400 m walk; 9 estimated access points across ~991 m of perimeter. edge density is healthy, no superblock penalty. Source coverage: centreline, pedestrian_network, transit_osm.
Source: Toronto Centreline V2 + Pedestrian Network + OSM transit stops
Amenity Diversity
5 distinct amenity types in the park (picnic, playground, sports_field, tennis, washroom). Diversity, not raw count, drives the score so a park with many distinct activity types can outrank a larger park that repeats the same use.
Source: Toronto Parks & Recreation Facilities + OSM amenity tags
Natural Comfort
Natural-comfort components for this park: 26.5% estimated tree canopy; nearest waterbody ~1047 m; 26 city-mapped trees inside the polygon (8.9/ha). Reading: partially shaded. Source coverage: treed_area, waterbodies, street_trees. Impervious surface is approximated (Toronto's authoritative layer ships only as a raster GeoTIFF).
Source: Toronto Treed Area + Ravine + Waterbodies + Street Tree Inventory
Enclosure / Eyes on Park
119 buildings within 25 m of the park edge (19 mid-rise, 96 low-rise, 4 tower); avg edge height 9.3 m (~3 floors); 12.0 buildings per 100 m of 991 m perimeter (strong frontage density); edges are at a Jacobs-scale walkable mid-rise (3 to 7 floors); 4 towers ≥ 40 m within 25 m of the edge. "Eyes on the park" come strongest from the 19 mid-rise edge buildings.
Source: Toronto 3D Massing (building footprints + heights)
Border Vacuum Risk
Border-vacuum factors within 50 m of the park: parking_lot, TTC employee parking, parking_lot, parking_lot, parking_lot, rail, rail, rail. Jacobs warned that highways, rail, parking lots and blank institutional edges act as "vacuums" that suppress foot traffic and isolate the park from its neighbourhood.
Source: Toronto Street Centreline (highways) + rail layer + OSM landuse + building footprints
Equity Context
Equity Context requires inputs not yet loaded for this park (Toronto Neighbourhood Profiles). Score is held at a neutral 50 with low confidence. Read with caution.
Source: Toronto Neighbourhood Profiles
Amenities (5 types · 6 records)
- picnic
- playground
- sports field
- tennis
- washroom
Nearby active-edge features (80)
- transit stop: Oriole Pkwy at Chaplin Cres2 m
- transit stop: Colin Avenue18 m
- parking lot21 m
- transit stop: Oriole Parkway27 m
- parking lot: TTC employee parking32 m
- rail33 m
- parking lot35 m
- parking lot36 m
- parking lot36 m
- rail39 m
- transit stop: Oriole Pkwy at Chaplin Cres South Side44 m
- transit stop: Duplex Avenue45 m
- rail46 m
- rail51 m
- rail53 m
- parking lot53 m
- transit stop: Oriole Parkway55 m
- transit stop55 m
- rail58 m
- parking lot62 m
- rail66 m
- transit stop: Duplex Avenue69 m
- rail71 m
- rail80 m
- rail82 m
- transit stop: Davisville89 m
- retail: Gateway Newsstands92 m
- transit stop: Davisville92 m
- transit stop: Davisville Station103 m
- transit stop: Davisville Station104 m
- rail106 m
- parking lot106 m
- rail106 m
- transit stop: Davisville Station108 m
- rail108 m
- transit stop: Davisville Station110 m
- rail112 m
- rail114 m
- rail117 m
- rail117 m
- rail: Yonge-University-Spadina Line118 m
- rail: Yonge-University-Spadina Line122 m
- transit stop: 1900 Yonge St Entrance124 m
- rail126 m
- rail127 m
- transit stop: Davisville132 m
- rail133 m
- rail135 m
- retail: First Class Dry Cleaners136 m
- highway: Yonge Street136 m
- highway: Yonge Street138 m
- rail140 m
- highway: Yonge Street140 m
- retail140 m
- highway: Yonge Street141 m
- rail146 m
- highway: Yonge Street147 m
- cafe: Tim Hortons147 m
- rail150 m
- rail150 m
- rail153 m
- transit stop: Chaplin Crescent154 m
- transit stop: Davisville Centre Entrance155 m
- restaurant: Thaï Express157 m
- retail: Yonge Vision159 m
- cafe: Second Cup160 m
- retail: Sightech161 m
- transit stop: Merton Street161 m
- restaurant: Mr. Sub162 m
- cafe: J.J's Deli & Cafe163 m
- rail163 m
- retail: Davisville Home Healthcare167 m
- highway: Yonge Street167 m
- restaurant: Tamasha167 m
- restaurant: The Bull a Firkin Pub170 m
- restaurant: Subway170 m
- transit stop: Merton Street170 m
- retail: Fresh Buy Market173 m
- retail: Rossa Linda176 m
- retail: Hair Dynasty182 m
Park profile
Five-axis radar across the structural dimensions.
Citywide percentile ranks
Across all Toronto parks in the dataset.
- Overall vitality81th
- Edge activation29th
- Connectivity98th
- Amenity diversity99th
- Natural comfort77th
- Enclosure91th
Most similar parks
Closest in metric space across the five structural dimensions.
- Monarch ParkNeighbourhood Park45
- Lawrence Park RavineRavine / Naturalized Park41
- Riverdale Park WestRavine / Naturalized Park46
- Christie Pits ParkRavine / Naturalized Park44
- Dovercourt ParkNeighbourhood Park48
Most opposite parks
Furthest in metric space. Useful for recognising what kind of park this isn’t.
- Rouge ParkRavine / Naturalized Park21
- Rouge ParkRavine / Naturalized Park18
- Trca Lands ( 58)Waterfront Park18
- Toronto Islands - Muggs Island ParkRavine / Naturalized Park25
- Queen'S Quay Traffic IslandWaterfront Park49
Visitor signals
Public attention measured by Google Places aggregates. This proxies attention, not occupancy. Aggregate-only: no usernames, no review text, no extra photos beyond the cached hero.
“Park with a playground & splash pad, plus sports facilities, washrooms & many shade trees.” (Google editorial summary)
p93 citywide · p91 within Neighbourhood Park
Source: Google Places API · match high (0.82 composite confidence) · last refreshed 5/9/2026. Privacy contract. Measures public attention, not occupancy.
Human activity signals: not available
No activity signals have landed for this park yet. The model has scored its physical form but it can’t yet say how often it’s programmed, photographed, or walked through. See /data-ethics for what we will and will not collect.
Does this score feel accurate?
Your read of Oriole Park - Torontomatters. We’re testing whether the model lines up with how people actually use the park. Submissions are stored locally; no account needed.
Tell us how this park feels
We measure structure (canopy, edges, connectivity). You measure feeling. Both matter, and disagreement is itself useful civic data.
What would improve this park?
Generated from the weakest measured dimensions: a starting point, not a prescription.
- Activate the edges: encourage cafés, retail or community uses on the streets that face the park; replace blank or parking-lot edges where possible.
- Diversify what people can do in the park (playground, washroom, water, shade, performance, sport, garden): even small additions raise this score.
- Mitigate border vacuums (highways, rail, parking) with active programming on the still-permeable edges and treat the hostile edge as a design challenge.
Data sources
- City of Toronto Open Data: Parks (Green Space)Polygon boundaries, official names, types.
- Parks & Recreation FacilitiesInventory of in-park amenities (washrooms, fields, rinks…).
- Toronto Pedestrian NetworkSidewalk segments around and through parks; estimated park entrances.
- Toronto Centreline V2Street segments + intersection nodes near park edges; trails and walkways.
- Toronto 3D MassingBuilding footprints + heights for edge-building counts, frontage density, and tower-in-the-park risk.
- Toronto Treed AreaTree canopy share inside park polygons via stratified-grid sampling.
- Toronto Waterbodies & RiversWater surface inside parks + nearest-water distance for cooling.
- Ravine & Natural Feature ProtectionRavine overlap as a cooling / natural-comfort signal.
- Toronto Street Tree InventoryTree count + density inside park polygons.
- Neighbourhood Profiles(Pending) Equity context proxy.
- OpenStreetMap (Overpass API)Cafés, restaurants, retail, transit stops, parking, highways, rail.