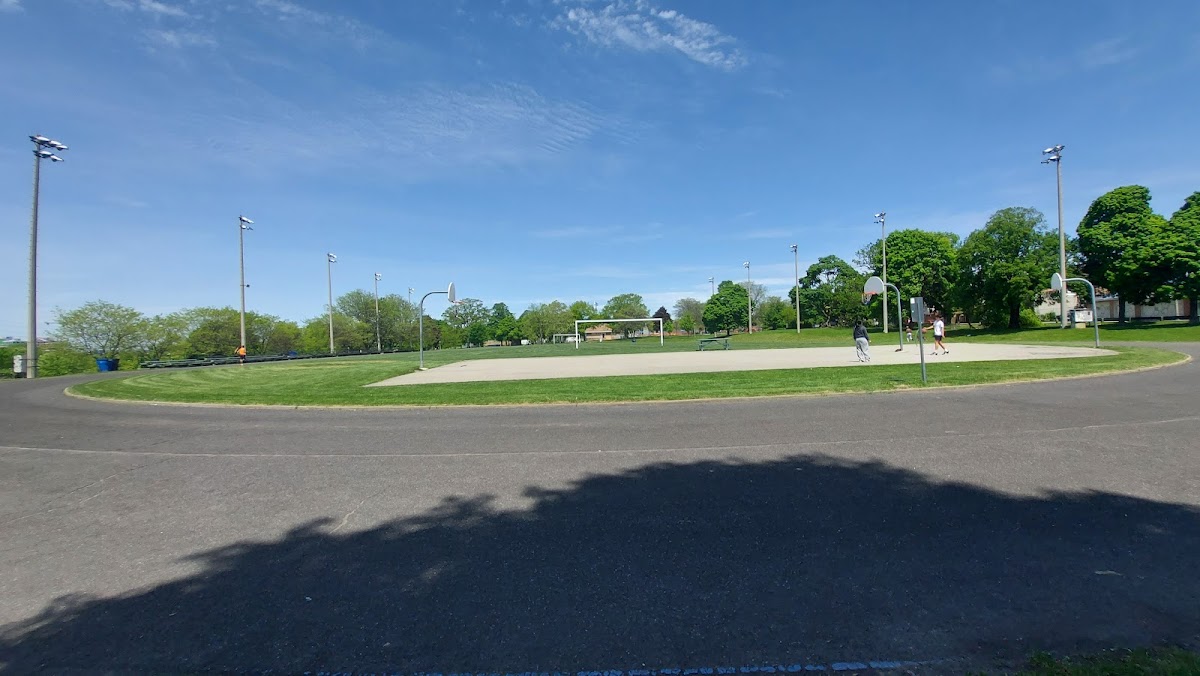
Earlscourt Park
Neighbourhood Park, in the top tier overall (score 44, rank ~87th percentile). Strongest: amenity diversity; weakest: edge activation.
Photo by Glenn Dickler via Google Places · cached 5/9/2026
Earlscourt Park scores 44 / 100. Strongest dimensions: connectivity and enclosure / eyes on park. Weakest: edge activation (0). Border-vacuum risk is elevated (100). This score is a transparent reading of Jane Jacobs-style vitality factors, not a definitive judgment.
Area · 12.66 ha
Weighted across six dimensions · confidence 68%
Scores are not bell-curved. Percentiles and expected scores provide context without changing the underlying model.
Loading map…
The parks map is loading.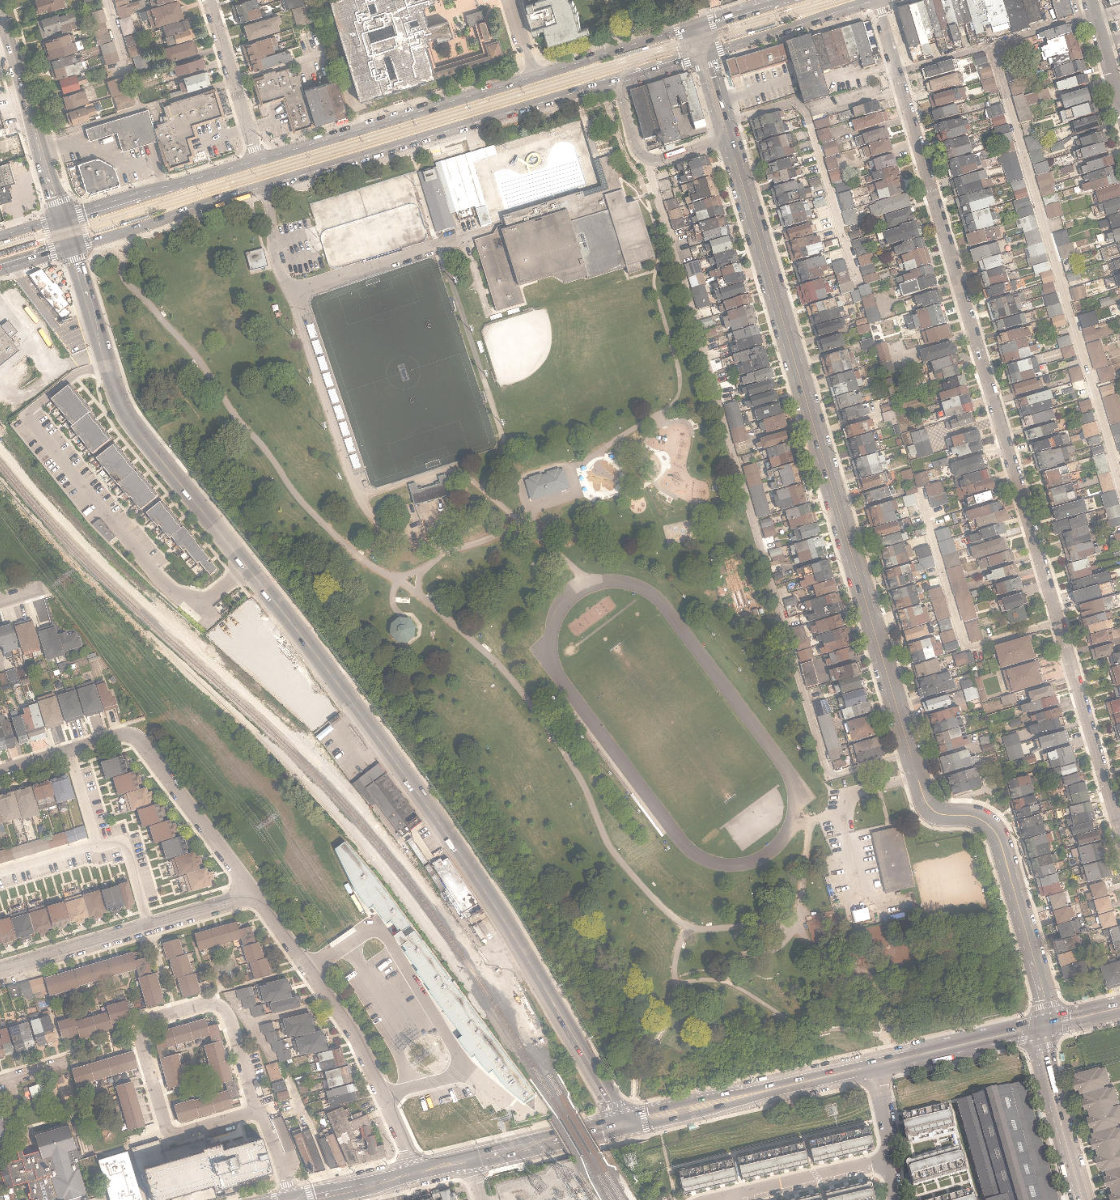
Explain this score
Where did the 44 come from? Each weighted contribution against a neutral 50 baseline. Green = pushed up; red = pulled down.
Sum of contributions = the headline score. A negative bar means that dimension dragged the park below the city-wide neutral baseline.
Why this park works
Earlscourt Park works because its amenity diversity score (57) is one of the city's strongest and its connectivity (82) is also top decile (10 distinct amenity types support different kinds of use).
What limits this park
Earlscourt Park is held back by edge activation (0, below-average): the surrounding streets carry too few active uses to spill into the park; border-vacuum risk is also elevated (100).
Most distinctive characteristic
Most distinctive feature: exceptionally high amenity diversity (57, top decile).
Jacobs reading
Earlscourt Park sits between an urban social park and an ecological retreat: moderately useful for both, exceptionally suited to neither.
Tradeoffs
- The park is enclosed by buildings (75) but the surrounding streets are quiet (edge activation 0): frame without animation.
- High connectivity coexists with high border-vacuum risk (100): much of that connectivity is to highways, rail, or parking lots, not to neighbourhoods.
Performance in context
- A modest overperformer for its neighbourhood park typology (+10 vs the median in large Neighbourhood Park).
Typology classification
Classified as Neighbourhood Park: 12.7 ha, framed by 24 mid-rise vs 0 towers. Secondary read: Destination Park (13 ha, 10 amenity types, connectivity 82 / comfort 59).
Edge Activation
Within 100 m of the park edge: 34 active uses (retail, restaurant, community, transit_stop, cafe) and 11 dead/hostile uses (rail, parking_lot). Active edges keep "eyes on the park" through the day; parking lots, blank institutional walls, rail and highway frontages drain street life.
Source: OSM POIs (amenity/shop) + Toronto Building Footprints + land use
Connectivity
Connectivity blends paths, intersections, transit, entrances, and edge density. This park has 34 mapped paths/walkways and 75 sidewalk segments within 50 m; 29 street intersections within 100 m; 36 transit stops within a 400 m walk; 11 estimated access points across ~1,648 m of perimeter. edge density is healthy, no superblock penalty. Source coverage: centreline, pedestrian_network, transit_osm.
Source: Toronto Centreline V2 + Pedestrian Network + OSM transit stops
Amenity Diversity
10 distinct amenity types in the park (basketball, community_centre, dog_area, fitness, picnic, playground, …). Diversity, not raw count, drives the score so a park with many distinct activity types can outrank a larger park that repeats the same use.
Source: Toronto Parks & Recreation Facilities + OSM amenity tags
Natural Comfort
Natural-comfort components for this park: ~17.6% effective canopy (0.0% from contiguous tree polygons + scattered tree density); 19.8% inside the ravine system; 318 city-mapped trees inside the polygon (25.1/ha). Reading: exposed. Source coverage: ravine, street_trees. Impervious surface is approximated (Toronto's authoritative layer ships only as a raster GeoTIFF).
Source: Toronto Treed Area + Ravine + Waterbodies + Street Tree Inventory
Enclosure / Eyes on Park
178 buildings within 25 m of the park edge (24 mid-rise, 154 low-rise, 0 tower); avg edge height 7.2 m (~2 floors); 10.8 buildings per 100 m of 1,648 m perimeter (strong frontage density); edges are low-rise (mostly 2 to 3 floors); no towers immediately adjacent. "Eyes on the park" come strongest from the 24 mid-rise edge buildings.
Source: Toronto 3D Massing (building footprints + heights)
Border Vacuum Risk
Border-vacuum factors within 50 m of the park: Newmarket Subdivision, parking_lot, parking_lot, parking_lot, Newmarket Subdivision, parking_lot, parking_lot, parking_lot. Jacobs warned that highways, rail, parking lots and blank institutional edges act as "vacuums" that suppress foot traffic and isolate the park from its neighbourhood.
Source: Toronto Street Centreline (highways) + rail layer + OSM landuse + building footprints
Equity Context
Equity Context requires inputs not yet loaded for this park (Toronto Neighbourhood Profiles). Score is held at a neutral 50 with low confidence. Read with caution.
Source: Toronto Neighbourhood Profiles
Amenities (10 types · 10 records)
- basketball
- community centre
- dog area
- fitness
- picnic
- playground
- sports field
- tennis
- track
- washroom
Nearby active-edge features (71)
- community: Joseph J. Piccininni Community Centre0 m
- parking lot0 m
- parking lot0 m
- parking lot0 m
- transit stop: St Clair Avenue West1 m
- transit stop: Davenport Rd at Caledonia Park Rd2 m
- transit stop: St Clair Avenue West13 m
- transit stop: Caledonia14 m
- transit stop: Foundry Avenue18 m
- transit stop: Caledonia Park Road19 m
- cafe: La Paloma20 m
- transit stop: Lansdowne25 m
- cafe: Poop-A-Licious26 m
- transit stop: Davenport Rd at Lansdowne Ave28 m
- transit stop: Caledonia Road28 m
- restaurant: Poop Cafe30 m
- restaurant: Dairy Freeze30 m
- transit stop: Davenport Rd31 m
- rail: Newmarket Subdivision34 m
- transit stop: Davenport Road34 m
- retail: Caledonia Bakery & Pastry35 m
- retail: Nova Era36 m
- restaurant: Castelo Sports Bar36 m
- retail: Astro Meats37 m
- restaurant: Rain Sushi38 m
- parking lot39 m
- parking lot40 m
- restaurant: Agio Ristorante41 m
- transit stop: 1216 Lansdowne Avenue41 m
- rail: Newmarket Subdivision45 m
- parking lot46 m
- restaurant: 241 Pizza47 m
- transit stop: Lansdowne Avenue50 m
- retail: Sunshine Market52 m
- transit stop: 1325 Lansdowne Avenue54 m
- restaurant: O Espeta Bar & Grill56 m
- transit stop: Caledonia57 m
- retail: Lovely Story58 m
- rail: Newmarket Subdivision60 m
- restaurant: Kapital Resturant and Grill62 m
- transit stop: St Clair Avenue West67 m
- rail: Newmarket Subdivision77 m
- parking lot82 m
- restaurant: Ti Carlo's Bar83 m
- retail: Verdi94 m
- transit stop: Lansdowne104 m
- restaurant: Cafe 512104 m
- parking lot112 m
- rail: Newmarket Subdivision114 m
- retail: VK Optical116 m
- retail: Ital Record & Sport117 m
- parking lot122 m
- restaurant: Sway127 m
- restaurant: Don Quixote137 m
- retail: Vespertine145 m
- parking lot147 m
- parking lot147 m
- parking lot150 m
- retail: Jasmine153 m
- retail: Ontario Fashion Textiles168 m
- parking lot168 m
- retail: Tanyas171 m
- restaurant: Távora176 m
- restaurant: Frank's Pizza House179 m
- transit stop: Davenport Rd at Primrose Ave179 m
- retail181 m
- cafe: Settemila Cafe184 m
- cafe186 m
- retail: Freedom Mobile189 m
- restaurant: La Bruschetta194 m
- retail: Praia de Mira200 m
Park profile
Five-axis radar across the structural dimensions.
Citywide percentile ranks
Across all Toronto parks in the dataset.
- Overall vitality87th
- Edge activation35th
- Connectivity99th
- Amenity diversity100th
- Natural comfort73th
- Enclosure76th
Most similar parks
Closest in metric space across the five structural dimensions.
- Christie Pits ParkRavine / Naturalized Park44
- Weston Lions ParkRavine / Naturalized Park43
- Tom Riley ParkWaterfront Park40
- Cedarvale ParkRavine / Naturalized Park45
- Monarch ParkNeighbourhood Park45
Most opposite parks
Furthest in metric space. Useful for recognising what kind of park this isn’t.
- Simcoe ParkTower-Community Green Space51
- Queen'S Quay Traffic IslandWaterfront Park49
- Toronto Islands - Muggs Island ParkRavine / Naturalized Park25
- Rouge ParkRavine / Naturalized Park21
- Rouge ParkRavine / Naturalized Park18
Visitor signals
Public attention measured by Google Places aggregates. This proxies attention, not occupancy. Aggregate-only: no usernames, no review text, no extra photos beyond the cached hero.
p12 citywide · p16 within Neighbourhood Park
Source: Google Places API · match medium (0.90 composite confidence) · last refreshed 5/9/2026. Privacy contract. Measures public attention, not occupancy.
Human activity signals: not available
No activity signals have landed for this park yet. The model has scored its physical form but it can’t yet say how often it’s programmed, photographed, or walked through. See /data-ethics for what we will and will not collect.
Does this score feel accurate?
Your read of Earlscourt Parkmatters. We’re testing whether the model lines up with how people actually use the park. Submissions are stored locally; no account needed.
Tell us how this park feels
We measure structure (canopy, edges, connectivity). You measure feeling. Both matter, and disagreement is itself useful civic data.
What would improve this park?
Generated from the weakest measured dimensions: a starting point, not a prescription.
- Activate the edges: encourage cafés, retail or community uses on the streets that face the park; replace blank or parking-lot edges where possible.
- Mitigate border vacuums (highways, rail, parking) with active programming on the still-permeable edges and treat the hostile edge as a design challenge.
Data sources
- City of Toronto Open Data: Parks (Green Space)Polygon boundaries, official names, types.
- Parks & Recreation FacilitiesInventory of in-park amenities (washrooms, fields, rinks…).
- Toronto Pedestrian NetworkSidewalk segments around and through parks; estimated park entrances.
- Toronto Centreline V2Street segments + intersection nodes near park edges; trails and walkways.
- Toronto 3D MassingBuilding footprints + heights for edge-building counts, frontage density, and tower-in-the-park risk.
- Toronto Treed AreaTree canopy share inside park polygons via stratified-grid sampling.
- Toronto Waterbodies & RiversWater surface inside parks + nearest-water distance for cooling.
- Ravine & Natural Feature ProtectionRavine overlap as a cooling / natural-comfort signal.
- Toronto Street Tree InventoryTree count + density inside park polygons.
- Neighbourhood Profiles(Pending) Equity context proxy.
- OpenStreetMap (Overpass API)Cafés, restaurants, retail, transit stops, parking, highways, rail.