Maryland Park
Neighbourhood Park, above average overall (score 40, rank ~73th percentile). Strongest: amenity diversity; weakest: natural comfort.
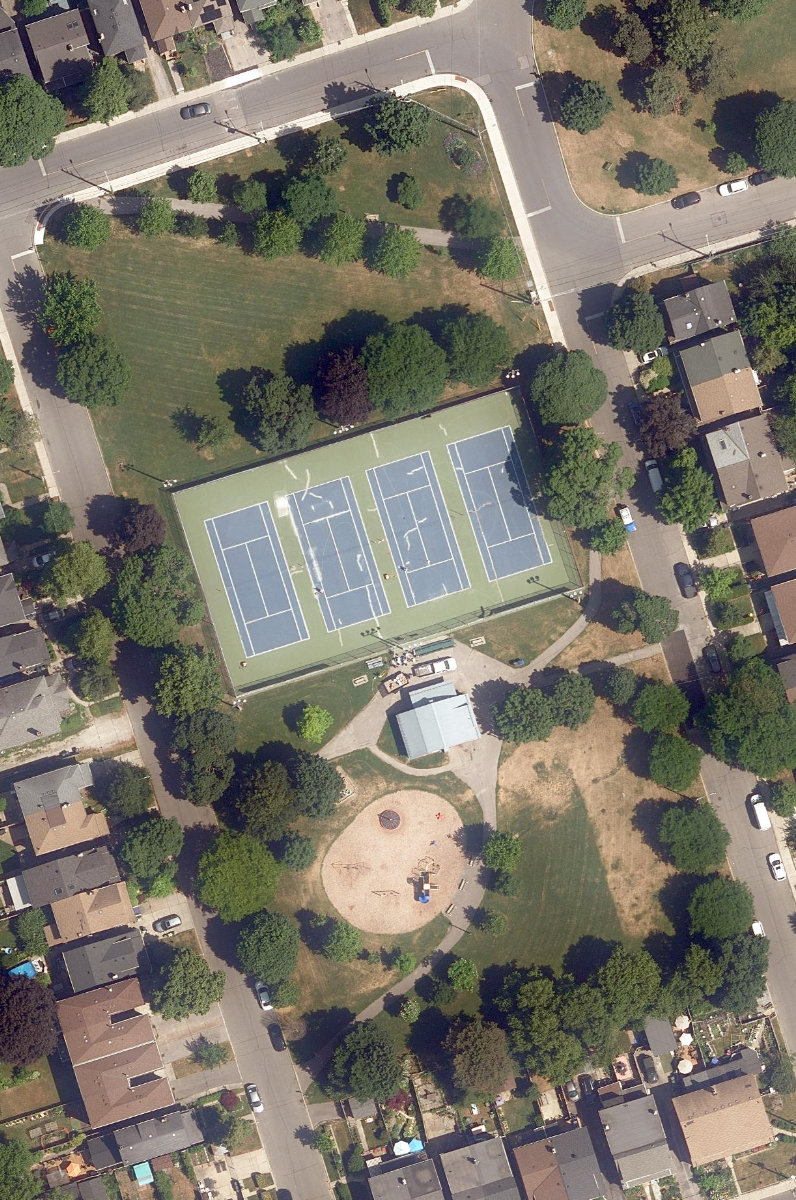
Aerial, City of Toronto orthophoto, ~8 cm/px source · cached 5/9/2026
Maryland Park scores 39.5 / 100. Strongest dimensions: connectivity and enclosure / eyes on park. Weakest: edge activation (0). Border-vacuum risk is elevated (36). This score is a transparent reading of Jane Jacobs-style vitality factors, not a definitive judgment.
Area · 1.03 ha
Weighted across six dimensions · confidence 72%
Scores are not bell-curved. Percentiles and expected scores provide context without changing the underlying model.
Loading map…
The parks map is loading.Explain this score
Where did the 40 come from? Each weighted contribution against a neutral 50 baseline. Green = pushed up; red = pulled down.
Sum of contributions = the headline score. A negative bar means that dimension dragged the park below the city-wide neutral baseline.
Why this park works
Maryland Park works because its amenity diversity score (28) is one of the city's strongest and its connectivity (70) is also top decile.
What limits this park
Maryland Park's edges are fronted by border-vacuum land uses (highways, rail, parking, blank institutional), risk score 36.
Most distinctive characteristic
Most distinctive feature: exceptionally high amenity diversity (28, top decile).
Jacobs reading
Maryland Park sits between an urban social park and an ecological retreat: moderately useful for both, exceptionally suited to neither.
Tradeoffs
- Connectivity (70) significantly outpaces natural comfort (43): well placed in the city but offers little shade or ecological respite.
- The park is enclosed by buildings (69) but the surrounding streets are quiet (edge activation 0): frame without animation.
Typology classification
Classified as Neighbourhood Park: 1.0 ha, framed by 1 mid-rise vs 0 towers
Edge Activation
Within 100 m of the park edge: 1 active uses (transit_stop) and 2 dead/hostile uses (rail). Active edges keep "eyes on the park" through the day; parking lots, blank institutional walls, rail and highway frontages drain street life.
Source: OSM POIs (amenity/shop) + Toronto Building Footprints + land use
Connectivity
Connectivity blends paths, intersections, transit, entrances, and edge density. This park has 8 mapped paths/walkways and 16 sidewalk segments within 50 m; 12 street intersections within 100 m; 14 transit stops within a 400 m walk; 6 estimated access points across ~439 m of perimeter. edge density is healthy, no superblock penalty. Source coverage: centreline, pedestrian_network, transit_osm.
Source: Toronto Centreline V2 + Pedestrian Network + OSM transit stops
Amenity Diversity
3 distinct amenity types in the park (playground, tennis, washroom). Diversity, not raw count, drives the score so a park with many distinct activity types can outrank a larger park that repeats the same use.
Source: Toronto Parks & Recreation Facilities + OSM amenity tags
Natural Comfort
Natural-comfort components for this park: ~6.1% effective canopy (4.1% from contiguous tree polygons + scattered tree density); nearest waterbody ~611 m; 9 city-mapped trees inside the polygon (8.8/ha). Reading: exposed. Source coverage: treed_area, waterbodies, street_trees. Impervious surface is approximated (Toronto's authoritative layer ships only as a raster GeoTIFF).
Source: Toronto Treed Area + Ravine + Waterbodies + Street Tree Inventory
Enclosure / Eyes on Park
150 buildings within 25 m of the park edge (1 mid-rise, 149 low-rise, 0 tower); avg edge height 6.3 m (~2 floors); 34.1 buildings per 100 m of 439 m perimeter (strong frontage density); edges are low-rise (mostly 2 to 3 floors); no towers immediately adjacent. "Eyes on the park" come strongest from the 1 mid-rise edge buildings.
Source: Toronto 3D Massing (building footprints + heights)
Border Vacuum Risk
Border-vacuum factors within 50 m of the park: Bloor-Danforth Line, Bloor-Danforth Line. Jacobs warned that highways, rail, parking lots and blank institutional edges act as "vacuums" that suppress foot traffic and isolate the park from its neighbourhood.
Source: Toronto Street Centreline (highways) + rail layer + OSM landuse + building footprints
Equity Context
Equity Context requires inputs not yet loaded for this park (Toronto Neighbourhood Profiles). Score is held at a neutral 50 with low confidence. Read with caution.
Source: Toronto Neighbourhood Profiles
Amenities (3 types · 3 records)
- playground
- tennis
- washroom
Nearby active-edge features (55)
- rail: Bloor-Danforth Line3 m
- rail: Bloor-Danforth Line4 m
- transit stop: Dawes Rd at Dentonia Park Ave100 m
- transit stop: Dawes Rd at Dentonia Park Ave102 m
- retail: Imag Convenience Store117 m
- retail: Leon's137 m
- retail: Fabric Town139 m
- retail: Concord140 m
- retail140 m
- restaurant: Main Event140 m
- retail: Buy & Sell Kings140 m
- retail141 m
- retail142 m
- retail: Danforth Flooring143 m
- retail143 m
- cafe: Jemila Dubai Coffee145 m
- retail: Your Carpet Connection148 m
- restaurant: Danforth Roti Shop148 m
- retail: Premium Cannabis151 m
- retail: Edwards & Davies151 m
- retail154 m
- transit stop: Dawes Rd at Second Ave154 m
- highway: Danforth Avenue156 m
- retail: Mattress & Furniture House157 m
- restaurant: Little Bangladesh Restaurant160 m
- retail: Sherwin-Williams165 m
- highway: Danforth Avenue165 m
- retail: Dawes & Secord Convenience166 m
- retail: Bike and Forth168 m
- highway: Danforth Avenue170 m
- retail: Chercher Butcher Store172 m
- restaurant: Pizzaiolo174 m
- retail: Dream Sense175 m
- retail175 m
- retail175 m
- retail: Kaniz Boutique House175 m
- retail: Jewellers Plus175 m
- restaurant: Khazana Queen175 m
- highway: Danforth Avenue178 m
- retail180 m
- transit stop: Secord Avenue182 m
- retail182 m
- retail: Dipika Fashion184 m
- restaurant: Two Brothers Shwarma184 m
- highway: Danforth Avenue185 m
- restaurant: Safa Fried Chicken & Cafe185 m
- retail186 m
- restaurant: Pizza Pizza187 m
- transit stop: Sibley Avenue188 m
- transit stop: Sibley Avenue188 m
- restaurant: Double Sushi191 m
- retail: SHE Next Fashion191 m
- transit stop: Dawes Rd at Danforth Ave194 m
- retail: Cash Money199 m
- retail: Elliot's Cigar Store200 m
Park profile
Five-axis radar across the structural dimensions.
Citywide percentile ranks
Across all Toronto parks in the dataset.
- Overall vitality73th
- Edge activation59th
- Connectivity91th
- Amenity diversity95th
- Natural comfort45th
- Enclosure67th
Most similar parks
Closest in metric space across the five structural dimensions.
- Flemington ParkCorridor / Linear Park33
- Stephenson ParkAthletic / Recreation Park41
- Laughlin ParkUrban Plaza42
- Eglinton FlatsWaterfront Park35
- Howard Talbot ParkAthletic / Recreation Park34
Most opposite parks
Furthest in metric space. Useful for recognising what kind of park this isn’t.
- Simcoe ParkTower-Community Green Space51
- Trca Lands ( 26)Ravine / Naturalized Park27
- Market Lane ParkUrban Plaza63
- Toronto Islands - Muggs Island ParkRavine / Naturalized Park25
- Manor Community GreenUrban Plaza57
Human activity signals: not available
No activity signals have landed for this park yet. The model has scored its physical form but it can’t yet say how often it’s programmed, photographed, or walked through. See /data-ethics for what we will and will not collect.
Does this score feel accurate?
Your read of Maryland Parkmatters. We’re testing whether the model lines up with how people actually use the park. Submissions are stored locally; no account needed.
Tell us how this park feels
We measure structure (canopy, edges, connectivity). You measure feeling. Both matter, and disagreement is itself useful civic data.
What would improve this park?
Generated from the weakest measured dimensions: a starting point, not a prescription.
- Activate the edges: encourage cafés, retail or community uses on the streets that face the park; replace blank or parking-lot edges where possible.
- Diversify what people can do in the park (playground, washroom, water, shade, performance, sport, garden): even small additions raise this score.
- Increase canopy and reduce paved area. Shade and water features extend usable hours and seasons.
- Mitigate border vacuums (highways, rail, parking) with active programming on the still-permeable edges and treat the hostile edge as a design challenge.
Data sources
- City of Toronto Open Data: Parks (Green Space)Polygon boundaries, official names, types.
- Parks & Recreation FacilitiesInventory of in-park amenities (washrooms, fields, rinks…).
- Toronto Pedestrian NetworkSidewalk segments around and through parks; estimated park entrances.
- Toronto Centreline V2Street segments + intersection nodes near park edges; trails and walkways.
- Toronto 3D MassingBuilding footprints + heights for edge-building counts, frontage density, and tower-in-the-park risk.
- Toronto Treed AreaTree canopy share inside park polygons via stratified-grid sampling.
- Toronto Waterbodies & RiversWater surface inside parks + nearest-water distance for cooling.
- Ravine & Natural Feature ProtectionRavine overlap as a cooling / natural-comfort signal.
- Toronto Street Tree InventoryTree count + density inside park polygons.
- Neighbourhood Profiles(Pending) Equity context proxy.
- OpenStreetMap (Overpass API)Cafés, restaurants, retail, transit stops, parking, highways, rail.