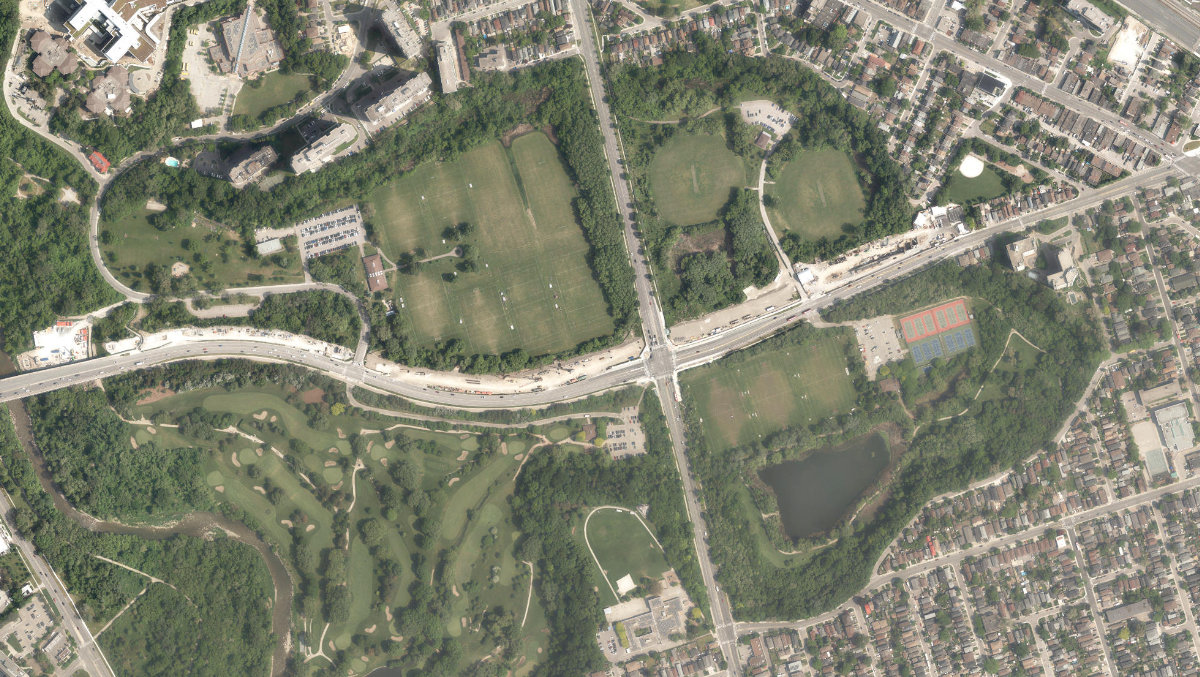
Eglinton Flats
Waterfront Park, middle of the pack overall (score 35, rank ~54th percentile). Strongest: connectivity; weakest: edge activation.
Aerial, City of Toronto orthophoto, ~8 cm/px source · cached 5/9/2026
Eglinton Flats scores 35 / 100. Strongest dimensions: connectivity and enclosure / eyes on park. Weakest: edge activation (0). Border-vacuum risk is elevated (100). This score is a transparent reading of Jane Jacobs-style vitality factors, not a definitive judgment.
Area · 36.43 ha
Weighted across six dimensions · confidence 72%
Scores are not bell-curved. Percentiles and expected scores provide context without changing the underlying model.
Loading map…
The parks map is loading.Explain this score
Where did the 35 come from? Each weighted contribution against a neutral 50 baseline. Green = pushed up; red = pulled down.
Sum of contributions = the headline score. A negative bar means that dimension dragged the park below the city-wide neutral baseline.
Why this park works
Eglinton Flats works because its connectivity score (76) is one of the city's strongest and its amenity diversity (28) is also top decile (66 transit stops sit within a 400 m walk; 26 intersections fall within 100 m of the edge).
What limits this park
Eglinton Flats's edges are fronted by border-vacuum land uses (highways, rail, parking, blank institutional), risk score 100.
Most distinctive characteristic
Most distinctive feature: exceptionally high connectivity (76, top decile).
Jacobs reading
Eglinton Flats sits between an urban social park and an ecological retreat: moderately useful for both, exceptionally suited to neither.
Tradeoffs
- Connectivity (76) significantly outpaces natural comfort (50): well placed in the city but offers little shade or ecological respite.
- The park is enclosed by buildings (68) but the surrounding streets are quiet (edge activation 0): frame without animation.
- 16 nearby towers cast wind and shadow without contributing canopy: passive surveillance is plentiful but human-scale comfort is not.
- High connectivity coexists with high border-vacuum risk (100): much of that connectivity is to highways, rail, or parking lots, not to neighbourhoods.
Typology classification
Classified as Waterfront Park: 6% water surface inside park. Secondary read: Ravine / Naturalized Park (100% ravine overlap, 4% canopy).
Edge Activation
Within 100 m of the park edge: 25 active uses (transit_stop, retail) and 29 dead/hostile uses (highway, parking_lot). Active edges keep "eyes on the park" through the day; parking lots, blank institutional walls, rail and highway frontages drain street life.
Source: OSM POIs (amenity/shop) + Toronto Building Footprints + land use
Connectivity
Connectivity blends paths, intersections, transit, entrances, and edge density. This park has 23 mapped paths/walkways and 91 sidewalk segments within 50 m; 26 street intersections within 100 m; 66 transit stops within a 400 m walk; 3 estimated access points across ~3,894 m of perimeter. moderate edge density, small superblock penalty applied. Source coverage: centreline, pedestrian_network, transit_osm.
Source: Toronto Centreline V2 + Pedestrian Network + OSM transit stops
Amenity Diversity
3 distinct amenity types in the park (playground, tennis, washroom). Diversity, not raw count, drives the score so a park with many distinct activity types can outrank a larger park that repeats the same use.
Source: Toronto Parks & Recreation Facilities + OSM amenity tags
Natural Comfort
Natural-comfort components for this park: 4.0% estimated tree canopy; 100.0% inside the ravine system; 5.7% water surface; 227 city-mapped trees inside the polygon (6.2/ha). Reading: ravine-cooled. Source coverage: treed_area, ravine, waterbodies, street_trees. Impervious surface is approximated (Toronto's authoritative layer ships only as a raster GeoTIFF).
Source: Toronto Treed Area + Ravine + Waterbodies + Street Tree Inventory
Enclosure / Eyes on Park
260 buildings within 25 m of the park edge (8 mid-rise, 236 low-rise, 16 tower); avg edge height 8.8 m (~3 floors); 6.7 buildings per 100 m of 3,894 m perimeter (strong frontage density); edges are low-rise (mostly 2 to 3 floors); 16 towers ≥ 40 m within 25 m of the edge. "Eyes on the park" come strongest from the 8 mid-rise edge buildings.
Source: Toronto 3D Massing (building footprints + heights)
Border Vacuum Risk
Border-vacuum factors within 50 m of the park: Eglinton Avenue West, parking_lot, parking_lot, parking_lot, parking_lot, Eglinton Avenue West, parking_lot, parking_lot, parking_lot, parking_lot, Eglinton Avenue West, Eglinton Avenue West, Eglinton Avenue West, Eglinton Avenue West, Eglinton Avenue West, Eglinton Avenue West, parking_lot, Eglinton Avenue West, Eglinton Avenue West, Eglinton Avenue West, Eglinton Avenue West, Eglinton Avenue West. Jacobs warned that highways, rail, parking lots and blank institutional edges act as "vacuums" that suppress foot traffic and isolate the park from its neighbourhood.
Source: Toronto Street Centreline (highways) + rail layer + OSM landuse + building footprints
Equity Context
Equity Context requires inputs not yet loaded for this park (Toronto Neighbourhood Profiles). Score is held at a neutral 50 with low confidence. Read with caution.
Source: Toronto Neighbourhood Profiles
Amenities (3 types · 3 records)
- playground
- tennis
- washroom
Nearby active-edge features (80)
- parking lot0 m
- retail: Tennis Club0 m
- parking lot0 m
- transit stop: Lambton Avenue3 m
- transit stop: 120 Emmett Ave at Roadway to West Park Healthcare Centre5 m
- highway: Eglinton Avenue West5 m
- transit stop: Emmett Avenue at Eglinton Avenue West5 m
- parking lot9 m
- transit stop: Jane Street West Side10 m
- parking lot12 m
- transit stop: Eglinton Avenue West at Jane Street East Side12 m
- transit stop: Emmett Avenue13 m
- parking lot18 m
- highway: Eglinton Avenue West20 m
- highway: Eglinton Avenue West21 m
- highway: Eglinton Avenue West25 m
- highway: Eglinton Avenue West25 m
- highway: Eglinton Avenue West25 m
- highway: Eglinton Avenue West25 m
- highway: Eglinton Avenue West25 m
- highway: Eglinton Avenue West26 m
- highway: Eglinton Avenue West27 m
- parking lot29 m
- highway: Eglinton Avenue West30 m
- transit stop: Lambton Avenue30 m
- highway: Eglinton Avenue West33 m
- transit stop: Eglinton Avenue West35 m
- parking lot36 m
- retail: Monica's Beauty Lounge36 m
- transit stop: Eglinton Avenue West37 m
- transit stop: Jane Street41 m
- transit stop: Emmett Avenue41 m
- transit stop: Jane Street41 m
- highway: Eglinton Avenue West45 m
- parking lot48 m
- parking lot48 m
- retail: Coin Laundry Maytag Equipped56 m
- highway: Eglinton Avenue West58 m
- transit stop: 85 Emmett Avenue59 m
- transit stop: Beechwood Avenue65 m
- transit stop: 106 Emmett Avenue68 m
- parking lot73 m
- parking lot77 m
- transit stop: Goldwin Avenue80 m
- parking lot83 m
- transit stop: Cornell Avenue86 m
- parking lot89 m
- transit stop: Eglinton Avenue West at Walkway to Emmett Avenue89 m
- transit stop: Opposite 3574 Eglinton Avenue West90 m
- parking lot90 m
- retail: Lambton Grocery91 m
- transit stop: Jane St at Bexley Cres93 m
- highway: Eglinton Avenue West95 m
- transit stop: 3574 Eglinton Avenue West96 m
- parking lot104 m
- parking lot104 m
- highway: Eglinton Avenue West106 m
- highway: Eglinton Avenue West109 m
- parking lot113 m
- parking lot118 m
- parking lot122 m
- retail: Daily Mart125 m
- highway: Eglinton Avenue West128 m
- highway: Eglinton Avenue West139 m
- transit stop: Verona Avenue141 m
- parking lot143 m
- highway: Eglinton Avenue West145 m
- transit stop: Lambton Avenue145 m
- parking lot164 m
- transit stop: Rockcliffe Boulevard168 m
- parking lot172 m
- highway: Eglinton Avenue West172 m
- transit stop: Verona Avenue174 m
- highway: Eglinton Avenue West181 m
- parking lot181 m
- retail: Lambton Convenience186 m
- transit stop: Jane Street192 m
- highway: Eglinton Avenue West194 m
- highway: Eglinton Avenue West198 m
- retail: Viele Bros. Auto Body200 m
Park profile
Five-axis radar across the structural dimensions.
Citywide percentile ranks
Across all Toronto parks in the dataset.
- Overall vitality54th
- Edge activation50th
- Connectivity96th
- Amenity diversity95th
- Natural comfort58th
- Enclosure65th
Most similar parks
Closest in metric space across the five structural dimensions.
- Goldhawk ParkCorridor / Linear Park37
- Goulding ParkAthletic / Recreation Park44
- Port Union Village Common ParkCorridor / Linear Park39
- Maryland ParkNeighbourhood Park40
- Ancaster ParkAthletic / Recreation Park42
Most opposite parks
Furthest in metric space. Useful for recognising what kind of park this isn’t.
- Simcoe ParkTower-Community Green Space51
- Joseph Burr Tyrrell ParkUrban Plaza50
- Trca Lands ( 26)Ravine / Naturalized Park27
- Manor Community GreenUrban Plaza57
- Toronto Islands - Muggs Island ParkRavine / Naturalized Park25
Human activity signals: not available
No activity signals have landed for this park yet. The model has scored its physical form but it can’t yet say how often it’s programmed, photographed, or walked through. See /data-ethics for what we will and will not collect.
Does this score feel accurate?
Your read of Eglinton Flatsmatters. We’re testing whether the model lines up with how people actually use the park. Submissions are stored locally; no account needed.
Tell us how this park feels
We measure structure (canopy, edges, connectivity). You measure feeling. Both matter, and disagreement is itself useful civic data.
What would improve this park?
Generated from the weakest measured dimensions: a starting point, not a prescription.
- Activate the edges: encourage cafés, retail or community uses on the streets that face the park; replace blank or parking-lot edges where possible.
- Diversify what people can do in the park (playground, washroom, water, shade, performance, sport, garden): even small additions raise this score.
- Increase canopy and reduce paved area. Shade and water features extend usable hours and seasons.
- Mitigate border vacuums (highways, rail, parking) with active programming on the still-permeable edges and treat the hostile edge as a design challenge.
Data sources
- City of Toronto Open Data: Parks (Green Space)Polygon boundaries, official names, types.
- Parks & Recreation FacilitiesInventory of in-park amenities (washrooms, fields, rinks…).
- Toronto Pedestrian NetworkSidewalk segments around and through parks; estimated park entrances.
- Toronto Centreline V2Street segments + intersection nodes near park edges; trails and walkways.
- Toronto 3D MassingBuilding footprints + heights for edge-building counts, frontage density, and tower-in-the-park risk.
- Toronto Treed AreaTree canopy share inside park polygons via stratified-grid sampling.
- Toronto Waterbodies & RiversWater surface inside parks + nearest-water distance for cooling.
- Ravine & Natural Feature ProtectionRavine overlap as a cooling / natural-comfort signal.
- Toronto Street Tree InventoryTree count + density inside park polygons.
- Neighbourhood Profiles(Pending) Equity context proxy.
- OpenStreetMap (Overpass API)Cafés, restaurants, retail, transit stops, parking, highways, rail.