Ancaster Park
Athletic / Recreation Park, above average overall (score 42, rank ~81th percentile). Strongest: amenity diversity; weakest: enclosure.
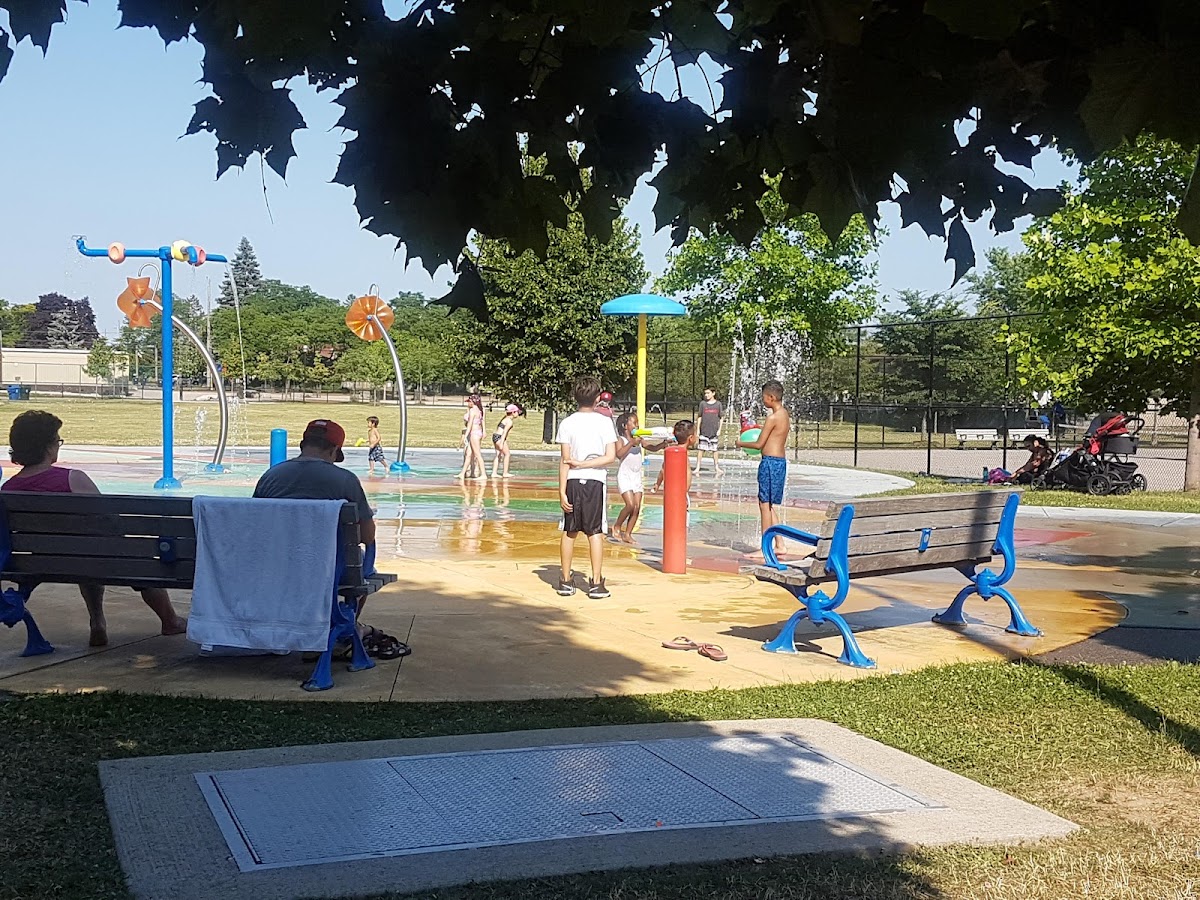
Photo by Ev Ha via Google Places · cached 5/9/2026
Ancaster Park scores 41.5 / 100. Strongest dimensions: connectivity and enclosure / eyes on park. Weakest: edge activation (1). Border-vacuum risk is elevated (36). This score is a transparent reading of Jane Jacobs-style vitality factors, not a definitive judgment.
Area · 2.87 ha
Weighted across six dimensions · confidence 68%
Scores are not bell-curved. Percentiles and expected scores provide context without changing the underlying model.
Loading map…
The parks map is loading.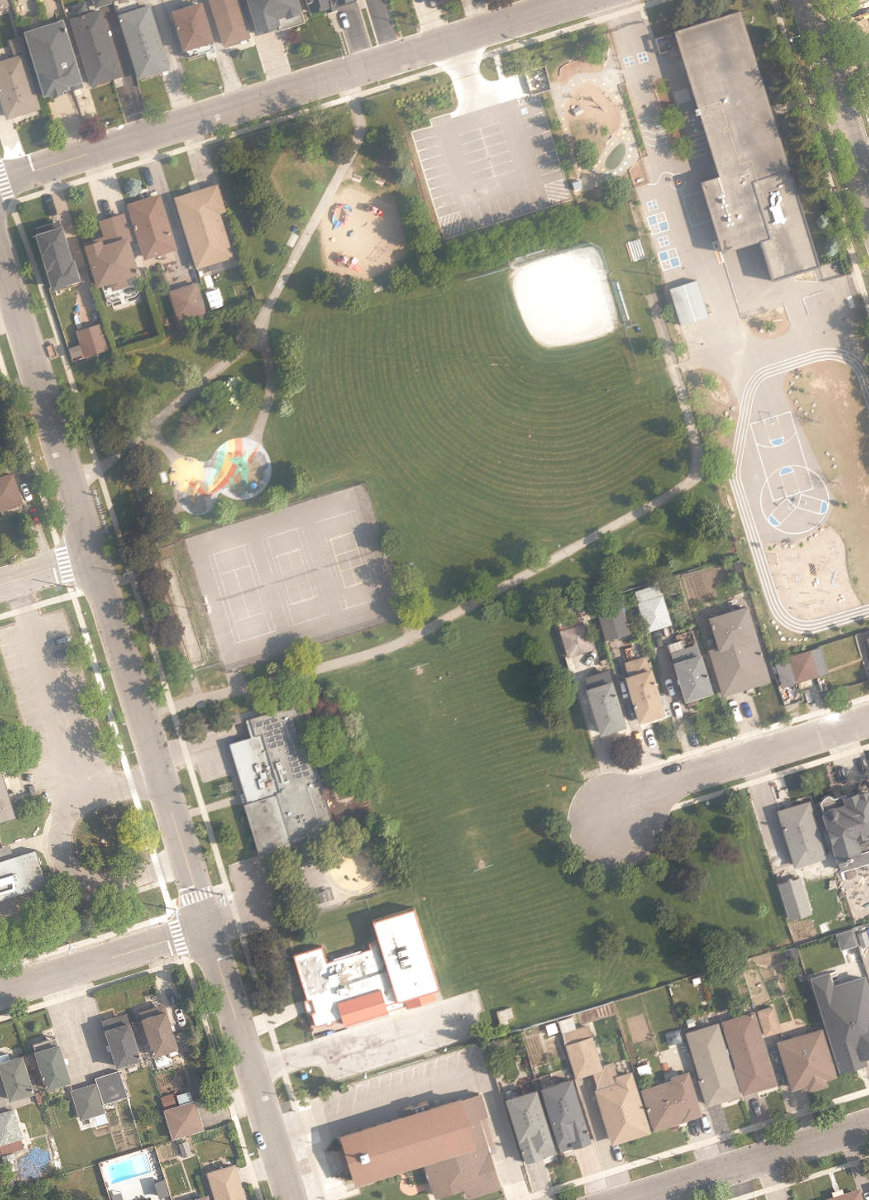
Explain this score
Where did the 42 come from? Each weighted contribution against a neutral 50 baseline. Green = pushed up; red = pulled down.
Sum of contributions = the headline score. A negative bar means that dimension dragged the park below the city-wide neutral baseline.
Why this park works
Ancaster Park works because its amenity diversity score (35) is one of the city's strongest and its connectivity (72) is also top decile.
What limits this park
Ancaster Park's edges are fronted by border-vacuum land uses (highways, rail, parking, blank institutional), risk score 36.
Most distinctive characteristic
Most distinctive feature: exceptionally high amenity diversity (35, top decile).
Jacobs reading
Ancaster Park sits between an urban social park and an ecological retreat: moderately useful for both, exceptionally suited to neither.
Tradeoffs
- The park is enclosed by buildings (63) but the surrounding streets are quiet (edge activation 1): frame without animation.
Performance in context
- Citywide rank is high (81st) but typology rank is more modest (48th): the strength likely comes from the dataset average pulling lower than this typology’s baseline.
Typology classification
Classified as Athletic / Recreation Park: 50% of amenity types are athletic (sports_field, tennis). Secondary read: Neighbourhood Park (2.9 ha, framed by 2 mid-rise vs 0 towers).
Edge Activation
Within 100 m of the park edge: 2 active uses (transit_stop) and 3 dead/hostile uses (parking_lot). Active edges keep "eyes on the park" through the day; parking lots, blank institutional walls, rail and highway frontages drain street life.
Source: OSM POIs (amenity/shop) + Toronto Building Footprints + land use
Connectivity
Connectivity blends paths, intersections, transit, entrances, and edge density. This park has 13 mapped paths/walkways and 16 sidewalk segments within 50 m; 13 street intersections within 100 m; 18 transit stops within a 400 m walk; 9 estimated access points across ~855 m of perimeter. edge density is healthy, no superblock penalty. Source coverage: centreline, pedestrian_network, transit_osm.
Source: Toronto Centreline V2 + Pedestrian Network + OSM transit stops
Amenity Diversity
4 distinct amenity types in the park (community_centre, playground, sports_field, tennis). Diversity, not raw count, drives the score so a park with many distinct activity types can outrank a larger park that repeats the same use.
Source: Toronto Parks & Recreation Facilities + OSM amenity tags
Natural Comfort
Natural-comfort components for this park: ~17.0% effective canopy (0.0% from contiguous tree polygons + scattered tree density); nearest waterbody ~1151 m; 70 city-mapped trees inside the polygon (24.4/ha). Reading: exposed. Source coverage: waterbodies, street_trees. Impervious surface is approximated (Toronto's authoritative layer ships only as a raster GeoTIFF).
Source: Toronto Treed Area + Ravine + Waterbodies + Street Tree Inventory
Enclosure / Eyes on Park
120 buildings within 25 m of the park edge (2 mid-rise, 118 low-rise, 0 tower); avg edge height 4.7 m (~2 floors); 14.0 buildings per 100 m of 855 m perimeter (strong frontage density); edges are barely there or single-storey; no towers immediately adjacent. "Eyes on the park" come strongest from the 2 mid-rise edge buildings.
Source: Toronto 3D Massing (building footprints + heights)
Border Vacuum Risk
Border-vacuum factors within 50 m of the park: parking_lot, parking_lot, parking_lot. Jacobs warned that highways, rail, parking lots and blank institutional edges act as "vacuums" that suppress foot traffic and isolate the park from its neighbourhood.
Source: Toronto Street Centreline (highways) + rail layer + OSM landuse + building footprints
Equity Context
Equity Context requires inputs not yet loaded for this park (Toronto Neighbourhood Profiles). Score is held at a neutral 50 with low confidence. Read with caution.
Source: Toronto Neighbourhood Profiles
Amenities (4 types · 4 records)
- community centre
- playground
- sports field
- tennis
Nearby active-edge features (56)
- parking lot16 m
- parking lot32 m
- parking lot41 m
- transit stop: Maniza Rd at Spalding Rd66 m
- transit stop: Maniza Rd at Plewes Rd76 m
- transit stop: Maniza Rd at Regent Rd106 m
- restaurant: Viet Chay vegetarian cuisine115 m
- retail: K&D Variety119 m
- restaurant: Curva Nord Bar119 m
- restaurant: Rosa Chilena119 m
- retail: Jillian's Vision of Beauty119 m
- retail: Alicia's Beauty Salon119 m
- restaurant: Lovely Pao119 m
- retail: Oz-Tech120 m
- restaurant: Dilly Sport's Bar120 m
- restaurant: Da Zio Mimmo120 m
- retail: Maple Leaf Locksmith120 m
- retail: One Two Three Nails & Spa121 m
- retail: Exclusive Barber Shop & Grooming121 m
- retail: Home Dry Cleaners & Alterations121 m
- retail: Joanne Nails & Spa121 m
- retail: La Rosa Chilena121 m
- retail: Sunny Days Smoke & Variety123 m
- restaurant: The Enchanted Poutinerie128 m
- restaurant: Lucky Wok Restaurant128 m
- retail: Enzo Salon129 m
- parking lot130 m
- retail136 m
- retail: AAA Vacuum Superstore136 m
- transit stop: Wilson Ave at Lady York Avenue138 m
- transit stop: Maniza Rd at Gilley Rd153 m
- restaurant: Subway156 m
- parking lot156 m
- retail: Aruba Health Spa157 m
- retail: Christine's Exquisites159 m
- retail: Queen Bee Hair & Nail Salon161 m
- retail: Local Products The Cannabis Store163 m
- transit stop: Wilson Ave at Lady York Avenue164 m
- restaurant: Buzz Buzz Pizza165 m
- retail: Brook-Lyn Hair Salon167 m
- retail: GTA Wireless169 m
- retail170 m
- cafe: Cocoon Coffee174 m
- retail: Ae Printing174 m
- retail: Moissy Fine Jewellery174 m
- transit stop: Ancaster Rd at Home Rd175 m
- retail: Golden Cut Hair Design175 m
- retail: Eaden Myles176 m
- retail: Datanet Computer Services176 m
- retail: Newroots179 m
- retail: Andy's Variety183 m
- retail: Doggle185 m
- retail: Sunshine Spa191 m
- parking lot192 m
- retail: Zsibi Flooring Ideas194 m
- retail: City Print198 m
Park profile
Five-axis radar across the structural dimensions.
Citywide percentile ranks
Across all Toronto parks in the dataset.
- Overall vitality81th
- Edge activation63th
- Connectivity92th
- Amenity diversity96th
- Natural comfort57th
- Enclosure50th
Most similar parks
Closest in metric space across the five structural dimensions.
- Prairie Drive ParkOther39
- Bellbury ParkNeighbourhood Park42
- Goldhawk ParkCorridor / Linear Park37
- Goulding ParkAthletic / Recreation Park44
- Colonel Samuel Smith ParkWaterfront Park34
Most opposite parks
Furthest in metric space. Useful for recognising what kind of park this isn’t.
- Market Lane ParkUrban Plaza63
- Manor Community GreenUrban Plaza57
- Simcoe ParkTower-Community Green Space51
- Joseph Burr Tyrrell ParkUrban Plaza50
- Bernard Avenue Road AllowanceUrban Plaza54
Visitor signals
Public attention measured by Google Places aggregates. This proxies attention, not occupancy. Aggregate-only: no usernames, no review text, no extra photos beyond the cached hero.
p68 citywide · p56 within Athletic / Recreation Park
Source: Google Places API · match high (0.99 composite confidence) · last refreshed 5/9/2026. Privacy contract. Measures public attention, not occupancy.
Human activity signals: not available
No activity signals have landed for this park yet. The model has scored its physical form but it can’t yet say how often it’s programmed, photographed, or walked through. See /data-ethics for what we will and will not collect.
Does this score feel accurate?
Your read of Ancaster Parkmatters. We’re testing whether the model lines up with how people actually use the park. Submissions are stored locally; no account needed.
Tell us how this park feels
We measure structure (canopy, edges, connectivity). You measure feeling. Both matter, and disagreement is itself useful civic data.
What would improve this park?
Generated from the weakest measured dimensions: a starting point, not a prescription.
- Activate the edges: encourage cafés, retail or community uses on the streets that face the park; replace blank or parking-lot edges where possible.
- Diversify what people can do in the park (playground, washroom, water, shade, performance, sport, garden): even small additions raise this score.
- Increase canopy and reduce paved area. Shade and water features extend usable hours and seasons.
- Mitigate border vacuums (highways, rail, parking) with active programming on the still-permeable edges and treat the hostile edge as a design challenge.
Data sources
- City of Toronto Open Data: Parks (Green Space)Polygon boundaries, official names, types.
- Parks & Recreation FacilitiesInventory of in-park amenities (washrooms, fields, rinks…).
- Toronto Pedestrian NetworkSidewalk segments around and through parks; estimated park entrances.
- Toronto Centreline V2Street segments + intersection nodes near park edges; trails and walkways.
- Toronto 3D MassingBuilding footprints + heights for edge-building counts, frontage density, and tower-in-the-park risk.
- Toronto Treed AreaTree canopy share inside park polygons via stratified-grid sampling.
- Toronto Waterbodies & RiversWater surface inside parks + nearest-water distance for cooling.
- Ravine & Natural Feature ProtectionRavine overlap as a cooling / natural-comfort signal.
- Toronto Street Tree InventoryTree count + density inside park polygons.
- Neighbourhood Profiles(Pending) Equity context proxy.
- OpenStreetMap (Overpass API)Cafés, restaurants, retail, transit stops, parking, highways, rail.