Stephenson Park
Athletic / Recreation Park, above average overall (score 41, rank ~80th percentile). Strongest: amenity diversity; weakest: natural comfort.
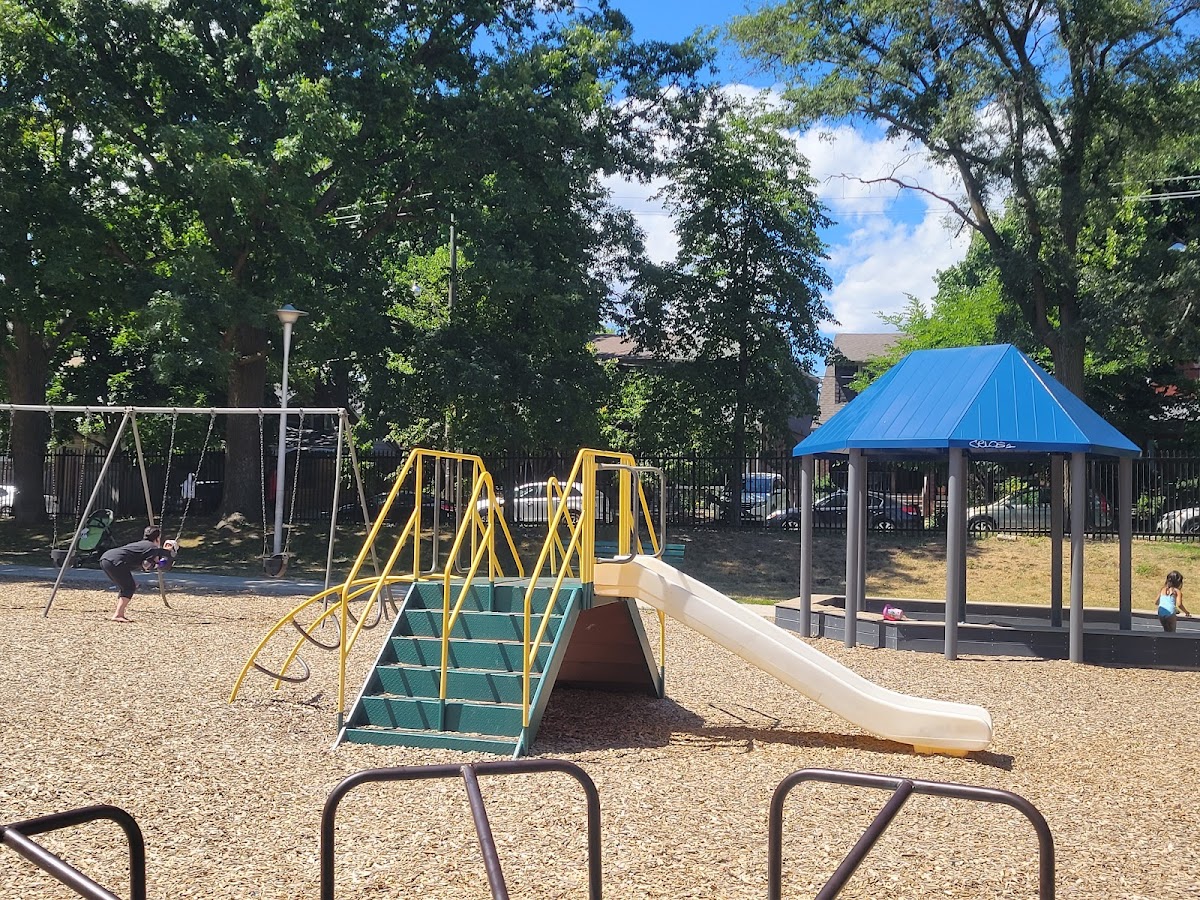
Photo by n fik via Google Places · cached 5/9/2026
Stephenson Park scores 41.2 / 100. Strongest dimensions: enclosure / eyes on park and connectivity. Weakest: edge activation (0). Border-vacuum risk is low. This score is a transparent reading of Jane Jacobs-style vitality factors, not a definitive judgment.
Area · 1.22 ha
Weighted across six dimensions · confidence 72%
Scores are not bell-curved. Percentiles and expected scores provide context without changing the underlying model.
Loading map…
The parks map is loading.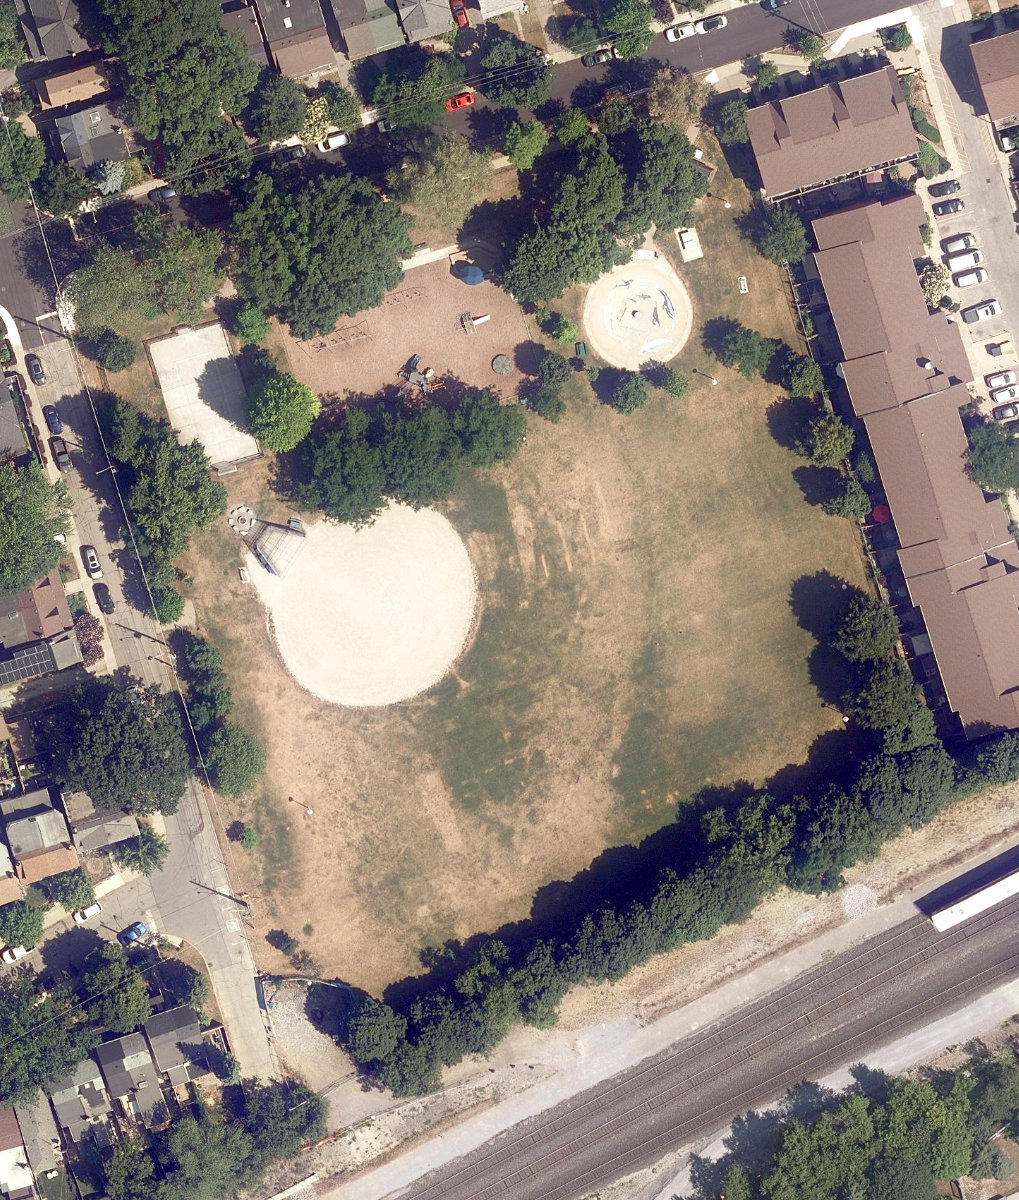
Explain this score
Where did the 41 come from? Each weighted contribution against a neutral 50 baseline. Green = pushed up; red = pulled down.
Sum of contributions = the headline score. A negative bar means that dimension dragged the park below the city-wide neutral baseline.
Why this park works
Stephenson Park works because its amenity diversity score (28) is in the top tier and its connectivity (64) is also top quartile.
What limits this park
Stephenson Park doesn't have a clear weakness. Every measured dimension is at or above the middle of the pack.
Most distinctive characteristic
Most distinctive feature: exceptionally high amenity diversity (28, top decile).
Jacobs reading
Stephenson Park sits between an urban social park and an ecological retreat: moderately useful for both, exceptionally suited to neither.
Tradeoffs
- The park is enclosed by buildings (74) but the surrounding streets are quiet (edge activation 0): frame without animation.
Performance in context
- Citywide rank is high (80th) but typology rank is more modest (46th): the strength likely comes from the dataset average pulling lower than this typology’s baseline.
Typology classification
Classified as Athletic / Recreation Park: 67% of amenity types are athletic (sports_field, tennis). Secondary read: Neighbourhood Park (1.2 ha, framed by 5 mid-rise vs 0 towers).
Edge Activation
Within 100 m of the park edge: 0 active uses (none) and 4 dead/hostile uses (parking_lot, rail). Active edges keep "eyes on the park" through the day; parking lots, blank institutional walls, rail and highway frontages drain street life.
Source: OSM POIs (amenity/shop) + Toronto Building Footprints + land use
Connectivity
Connectivity blends paths, intersections, transit, entrances, and edge density. This park has 5 mapped paths/walkways and 6 sidewalk segments within 50 m; 15 street intersections within 100 m; 28 transit stops within a 400 m walk; 3 estimated access points across ~444 m of perimeter. edge density is healthy, no superblock penalty. Source coverage: centreline, pedestrian_network, transit_osm.
Source: Toronto Centreline V2 + Pedestrian Network + OSM transit stops
Amenity Diversity
3 distinct amenity types in the park (playground, sports_field, tennis). Diversity, not raw count, drives the score so a park with many distinct activity types can outrank a larger park that repeats the same use.
Source: Toronto Parks & Recreation Facilities + OSM amenity tags
Natural Comfort
Natural-comfort components for this park: 5.7% estimated tree canopy; nearest waterbody ~1014 m; 11 city-mapped trees inside the polygon (9.0/ha). Reading: exposed. Source coverage: treed_area, waterbodies, street_trees. Impervious surface is approximated (Toronto's authoritative layer ships only as a raster GeoTIFF).
Source: Toronto Treed Area + Ravine + Waterbodies + Street Tree Inventory
Enclosure / Eyes on Park
87 buildings within 25 m of the park edge (5 mid-rise, 82 low-rise, 0 tower); avg edge height 6.6 m (~2 floors); 19.6 buildings per 100 m of 444 m perimeter (strong frontage density); edges are low-rise (mostly 2 to 3 floors); no towers immediately adjacent. "Eyes on the park" come strongest from the 5 mid-rise edge buildings.
Source: Toronto 3D Massing (building footprints + heights)
Border Vacuum Risk
Border-vacuum factors within 50 m of the park: parking_lot. Jacobs warned that highways, rail, parking lots and blank institutional edges act as "vacuums" that suppress foot traffic and isolate the park from its neighbourhood.
Source: Toronto Street Centreline (highways) + rail layer + OSM landuse + building footprints
Equity Context
Equity Context requires inputs not yet loaded for this park (Toronto Neighbourhood Profiles). Score is held at a neutral 50 with low confidence. Read with caution.
Source: Toronto Neighbourhood Profiles
Amenities (3 types · 3 records)
- playground
- sports field
- tennis
Nearby active-edge features (49)
- parking lot30 m
- rail: Kingston Subdivision98 m
- rail: Kingston Subdivision99 m
- parking lot99 m
- parking lot104 m
- parking lot117 m
- parking lot118 m
- transit stop: Danforth124 m
- retail: Real Bargain131 m
- highway: Danforth Avenue132 m
- rail: Kingston Subdivision133 m
- highway: Danforth Avenue134 m
- highway: Danforth Avenue135 m
- retail: Danforth Picture Frames137 m
- retail: Danforth Village139 m
- parking lot140 m
- highway: Danforth Avenue143 m
- transit stop: Danforth146 m
- retail: ASM Wireless148 m
- retail: Beauty One149 m
- retail: Perfume Depot & Cosmetics150 m
- highway: Danforth Avenue151 m
- retail: Selam Furniture & Mattress152 m
- retail: Many Chances Health Spa152 m
- cafe: Press Books Coffee Vinyl152 m
- retail: Budside Cannabis Store152 m
- retail152 m
- retail: NaNa Florist153 m
- retail153 m
- retail: Yonges E-Bikes153 m
- retail: Wellwise154 m
- rail: Kingston Subdivision156 m
- rail: Kingston Subdivision156 m
- rail: Kingston Subdivision157 m
- retail: Vincenzo Supermarket158 m
- retail: A to Z Discount159 m
- highway: Danforth Avenue165 m
- retail: A+ Cut165 m
- highway: Danforth Avenue166 m
- retail174 m
- retail: Hakim Optical175 m
- parking lot176 m
- parking lot177 m
- transit stop: Danforth Avenue178 m
- highway: Danforth Avenue187 m
- restaurant: Golden Pizza188 m
- highway: Danforth Avenue193 m
- transit stop: Danforth Avenue194 m
- transit stop: Danforth Avenue194 m
Park profile
Five-axis radar across the structural dimensions.
Citywide percentile ranks
Across all Toronto parks in the dataset.
- Overall vitality80th
- Edge activation50th
- Connectivity81th
- Amenity diversity95th
- Natural comfort44th
- Enclosure75th
Most similar parks
Closest in metric space across the five structural dimensions.
- ANTIBES COMMUNITY CENTRE - Building GroundsAthletic / Recreation Park39
- Park Lawn ParkAthletic / Recreation Park38
- Howard Talbot ParkAthletic / Recreation Park34
- Leaside ParkAthletic / Recreation Park33
- Dennis Flynn ParkNeighbourhood Park39
Most opposite parks
Furthest in metric space. Useful for recognising what kind of park this isn’t.
- Simcoe ParkTower-Community Green Space51
- Trca Lands ( 26)Ravine / Naturalized Park27
- Market Lane ParkUrban Plaza63
- Toronto Islands - Muggs Island ParkRavine / Naturalized Park25
- Mclevin Woods ParkRavine / Naturalized Park49
Visitor signals
Public attention measured by Google Places aggregates. This proxies attention, not occupancy. Aggregate-only: no usernames, no review text, no extra photos beyond the cached hero.
p75 citywide · p71 within Athletic / Recreation Park
Source: Google Places API · match high (0.98 composite confidence) · last refreshed 5/9/2026. Privacy contract. Measures public attention, not occupancy.
Human activity signals: not available
No activity signals have landed for this park yet. The model has scored its physical form but it can’t yet say how often it’s programmed, photographed, or walked through. See /data-ethics for what we will and will not collect.
Does this score feel accurate?
Your read of Stephenson Parkmatters. We’re testing whether the model lines up with how people actually use the park. Submissions are stored locally; no account needed.
Tell us how this park feels
We measure structure (canopy, edges, connectivity). You measure feeling. Both matter, and disagreement is itself useful civic data.
What would improve this park?
Generated from the weakest measured dimensions: a starting point, not a prescription.
- Activate the edges: encourage cafés, retail or community uses on the streets that face the park; replace blank or parking-lot edges where possible.
- Diversify what people can do in the park (playground, washroom, water, shade, performance, sport, garden): even small additions raise this score.
- Increase canopy and reduce paved area. Shade and water features extend usable hours and seasons.
Data sources
- City of Toronto Open Data: Parks (Green Space)Polygon boundaries, official names, types.
- Parks & Recreation FacilitiesInventory of in-park amenities (washrooms, fields, rinks…).
- Toronto Pedestrian NetworkSidewalk segments around and through parks; estimated park entrances.
- Toronto Centreline V2Street segments + intersection nodes near park edges; trails and walkways.
- Toronto 3D MassingBuilding footprints + heights for edge-building counts, frontage density, and tower-in-the-park risk.
- Toronto Treed AreaTree canopy share inside park polygons via stratified-grid sampling.
- Toronto Waterbodies & RiversWater surface inside parks + nearest-water distance for cooling.
- Ravine & Natural Feature ProtectionRavine overlap as a cooling / natural-comfort signal.
- Toronto Street Tree InventoryTree count + density inside park polygons.
- Neighbourhood Profiles(Pending) Equity context proxy.
- OpenStreetMap (Overpass API)Cafés, restaurants, retail, transit stops, parking, highways, rail.