Howard Talbot Park
Athletic / Recreation Park, middle of the pack overall (score 34, rank ~50th percentile). Strongest: amenity diversity; weakest: edge activation.
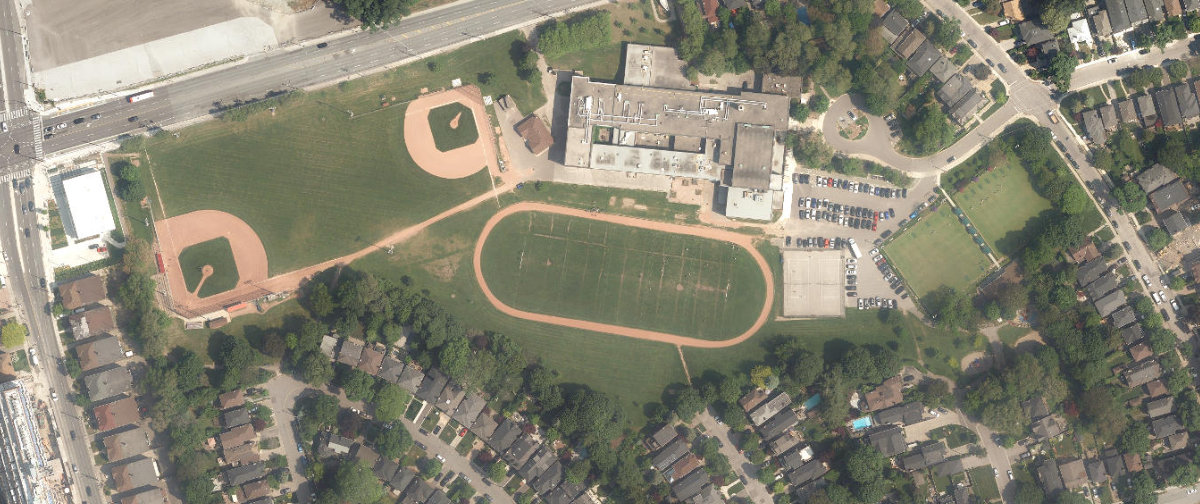
Aerial, City of Toronto orthophoto, ~8 cm/px source · cached 5/9/2026
Howard Talbot Park scores 34.1 / 100. Strongest dimensions: enclosure / eyes on park and connectivity. Weakest: edge activation (0). Border-vacuum risk is elevated (100). This score is a transparent reading of Jane Jacobs-style vitality factors, not a definitive judgment.
Area · 4.92 ha
Weighted across six dimensions · confidence 72%
Scores are not bell-curved. Percentiles and expected scores provide context without changing the underlying model.
Loading map…
The parks map is loading.Explain this score
Where did the 34 come from? Each weighted contribution against a neutral 50 baseline. Green = pushed up; red = pulled down.
Sum of contributions = the headline score. A negative bar means that dimension dragged the park below the city-wide neutral baseline.
Why this park works
Howard Talbot Park works because its amenity diversity score (35) is one of the city's strongest and its connectivity (67) is also top quartile.
What limits this park
Howard Talbot Park's edges are fronted by border-vacuum land uses (highways, rail, parking, blank institutional), risk score 100.
Most distinctive characteristic
Most distinctive feature: exceptionally high amenity diversity (35, top decile).
Jacobs reading
Howard Talbot Park sits between an urban social park and an ecological retreat: moderately useful for both, exceptionally suited to neither.
Tradeoffs
- The park is enclosed by buildings (74) but the surrounding streets are quiet (edge activation 0): frame without animation.
- High connectivity coexists with high border-vacuum risk (100): much of that connectivity is to highways, rail, or parking lots, not to neighbourhoods.
Performance in context
- Reads as a modest underperformer relative to comparable parks (gap -8; cohort: medium Athletic / Recreation Park).
- Citywide rank is high (50th) but typology rank is more modest (4th): the strength likely comes from the dataset average pulling lower than this typology’s baseline.
Typology classification
Classified as Athletic / Recreation Park: 50% of amenity types are athletic (sports_field, tennis). Secondary read: Neighbourhood Park (4.9 ha, framed by 15 mid-rise vs 0 towers).
Edge Activation
Within 100 m of the park edge: 12 active uses (retail, transit_stop, cafe) and 10 dead/hostile uses (parking_lot, highway). Active edges keep "eyes on the park" through the day; parking lots, blank institutional walls, rail and highway frontages drain street life.
Source: OSM POIs (amenity/shop) + Toronto Building Footprints + land use
Connectivity
Connectivity blends paths, intersections, transit, entrances, and edge density. This park has 7 mapped paths/walkways and 22 sidewalk segments within 50 m; 13 street intersections within 100 m; 21 transit stops within a 400 m walk; 5 estimated access points across ~1,401 m of perimeter. moderate edge density, small superblock penalty applied. Source coverage: centreline, pedestrian_network, transit_osm.
Source: Toronto Centreline V2 + Pedestrian Network + OSM transit stops
Amenity Diversity
4 distinct amenity types in the park (playground, sports_field, tennis, washroom). Diversity, not raw count, drives the score so a park with many distinct activity types can outrank a larger park that repeats the same use.
Source: Toronto Parks & Recreation Facilities + OSM amenity tags
Natural Comfort
Natural-comfort components for this park: 5.9% estimated tree canopy; nearest waterbody ~951 m; 6 city-mapped trees inside the polygon (1.2/ha). Reading: exposed. Source coverage: treed_area, waterbodies, street_trees. Impervious surface is approximated (Toronto's authoritative layer ships only as a raster GeoTIFF).
Source: Toronto Treed Area + Ravine + Waterbodies + Street Tree Inventory
Enclosure / Eyes on Park
200 buildings within 25 m of the park edge (15 mid-rise, 185 low-rise, 0 tower); avg edge height 7.0 m (~2 floors); 14.3 buildings per 100 m of 1,401 m perimeter (strong frontage density); edges are low-rise (mostly 2 to 3 floors); no towers immediately adjacent. "Eyes on the park" come strongest from the 15 mid-rise edge buildings.
Source: Toronto 3D Massing (building footprints + heights)
Border Vacuum Risk
Border-vacuum factors within 50 m of the park: parking_lot, parking_lot, Eglinton Avenue East, Eglinton Avenue East, Eglinton Avenue East, Eglinton Avenue East, Eglinton Avenue East, Eglinton Avenue East, Eglinton Avenue East. Jacobs warned that highways, rail, parking lots and blank institutional edges act as "vacuums" that suppress foot traffic and isolate the park from its neighbourhood.
Source: Toronto Street Centreline (highways) + rail layer + OSM landuse + building footprints
Equity Context
Equity Context requires inputs not yet loaded for this park (Toronto Neighbourhood Profiles). Score is held at a neutral 50 with low confidence. Read with caution.
Source: Toronto Neighbourhood Profiles
Amenities (4 types · 4 records)
- playground
- sports field
- tennis
- washroom
Nearby active-edge features (46)
- parking lot0 m
- transit stop: Bayview Avenue1 m
- highway: Eglinton Avenue East12 m
- highway: Eglinton Avenue East12 m
- highway: Eglinton Avenue East13 m
- transit stop: Leaside16 m
- highway: Eglinton Avenue East20 m
- transit stop: Leaside23 m
- highway: Eglinton Avenue East28 m
- parking lot30 m
- transit stop: Bayview Avenue34 m
- highway: Eglinton Avenue East45 m
- highway: Eglinton Avenue East46 m
- transit stop: Leaside48 m
- transit stop: Donlea Drive48 m
- transit stop: Leaside49 m
- retail: EcoPure Cleaners68 m
- retail: Herbal Magic Weight Loss & Nutrition Centres68 m
- transit stop: Leaside69 m
- cafe: Tim Hortons73 m
- highway: Eglinton Avenue East73 m
- retail: Collage Designs90 m
- transit stop: Parkhurst Boulevard107 m
- transit stop: Hanna Road113 m
- transit stop: Soudan Avenue118 m
- highway: Eglinton Avenue East122 m
- highway: Eglinton Avenue East122 m
- parking lot127 m
- highway: Eglinton Avenue East130 m
- parking lot131 m
- parking lot136 m
- retail: Parkers Custom Cleaning Care137 m
- transit stop: Hanna Road141 m
- parking lot145 m
- retail: Natalie Nails156 m
- parking lot157 m
- retail: Leaside Vape Shop160 m
- retail: Relevé165 m
- highway: Eglinton Avenue East171 m
- retail: No Frills171 m
- retail: Alice’s Art Studio173 m
- restaurant173 m
- transit stop: Rumsey Road174 m
- retail: Canna Cabana179 m
- retail: Vision Eyecare Centre186 m
- retail: Royal Wellness Spa192 m
Park profile
Five-axis radar across the structural dimensions.
Citywide percentile ranks
Across all Toronto parks in the dataset.
- Overall vitality50th
- Edge activation38th
- Connectivity86th
- Amenity diversity97th
- Natural comfort44th
- Enclosure75th
Most similar parks
Closest in metric space across the five structural dimensions.
- Leaside ParkAthletic / Recreation Park33
- Stephenson ParkAthletic / Recreation Park41
- ANTIBES COMMUNITY CENTRE - Building GroundsAthletic / Recreation Park39
- Maryland ParkNeighbourhood Park40
- Park Lawn ParkAthletic / Recreation Park38
Most opposite parks
Furthest in metric space. Useful for recognising what kind of park this isn’t.
- Trca Lands ( 26)Ravine / Naturalized Park27
- Simcoe ParkTower-Community Green Space51
- Toronto Islands - Muggs Island ParkRavine / Naturalized Park25
- Market Lane ParkUrban Plaza63
- Mclevin Woods ParkRavine / Naturalized Park49
Human activity signals: not available
No activity signals have landed for this park yet. The model has scored its physical form but it can’t yet say how often it’s programmed, photographed, or walked through. See /data-ethics for what we will and will not collect.
Does this score feel accurate?
Your read of Howard Talbot Parkmatters. We’re testing whether the model lines up with how people actually use the park. Submissions are stored locally; no account needed.
Tell us how this park feels
We measure structure (canopy, edges, connectivity). You measure feeling. Both matter, and disagreement is itself useful civic data.
What would improve this park?
Generated from the weakest measured dimensions: a starting point, not a prescription.
- Activate the edges: encourage cafés, retail or community uses on the streets that face the park; replace blank or parking-lot edges where possible.
- Diversify what people can do in the park (playground, washroom, water, shade, performance, sport, garden): even small additions raise this score.
- Increase canopy and reduce paved area. Shade and water features extend usable hours and seasons.
- Mitigate border vacuums (highways, rail, parking) with active programming on the still-permeable edges and treat the hostile edge as a design challenge.
Data sources
- City of Toronto Open Data: Parks (Green Space)Polygon boundaries, official names, types.
- Parks & Recreation FacilitiesInventory of in-park amenities (washrooms, fields, rinks…).
- Toronto Pedestrian NetworkSidewalk segments around and through parks; estimated park entrances.
- Toronto Centreline V2Street segments + intersection nodes near park edges; trails and walkways.
- Toronto 3D MassingBuilding footprints + heights for edge-building counts, frontage density, and tower-in-the-park risk.
- Toronto Treed AreaTree canopy share inside park polygons via stratified-grid sampling.
- Toronto Waterbodies & RiversWater surface inside parks + nearest-water distance for cooling.
- Ravine & Natural Feature ProtectionRavine overlap as a cooling / natural-comfort signal.
- Toronto Street Tree InventoryTree count + density inside park polygons.
- Neighbourhood Profiles(Pending) Equity context proxy.
- OpenStreetMap (Overpass API)Cafés, restaurants, retail, transit stops, parking, highways, rail.