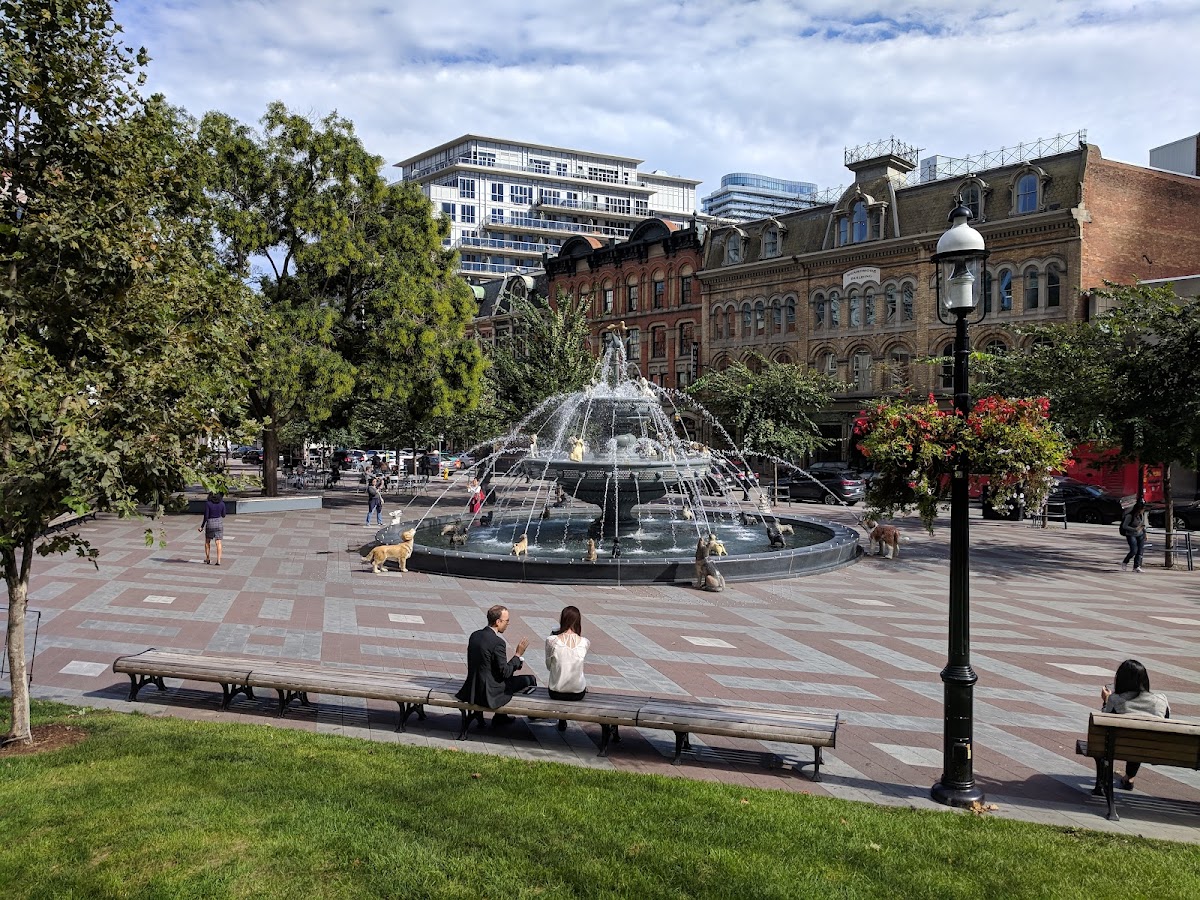
Berczy Park
Civic Square, one of the city's strongest overall (score 59, rank ~99th percentile). Strongest: edge activation; weakest: amenity diversity.
Photo by Mike Rogan via Google Places · cached 5/9/2026
Berczy Park scores 58.5 / 100. Strongest dimensions: connectivity and edge activation. Weakest: amenity diversity (0). Border-vacuum risk is low. This score is a transparent reading of Jane Jacobs-style vitality factors, not a definitive judgment.
Area · 0.36 ha
Weighted across six dimensions · confidence 63%
Scores are not bell-curved. Percentiles and expected scores provide context without changing the underlying model.
Loading map…
The parks map is loading.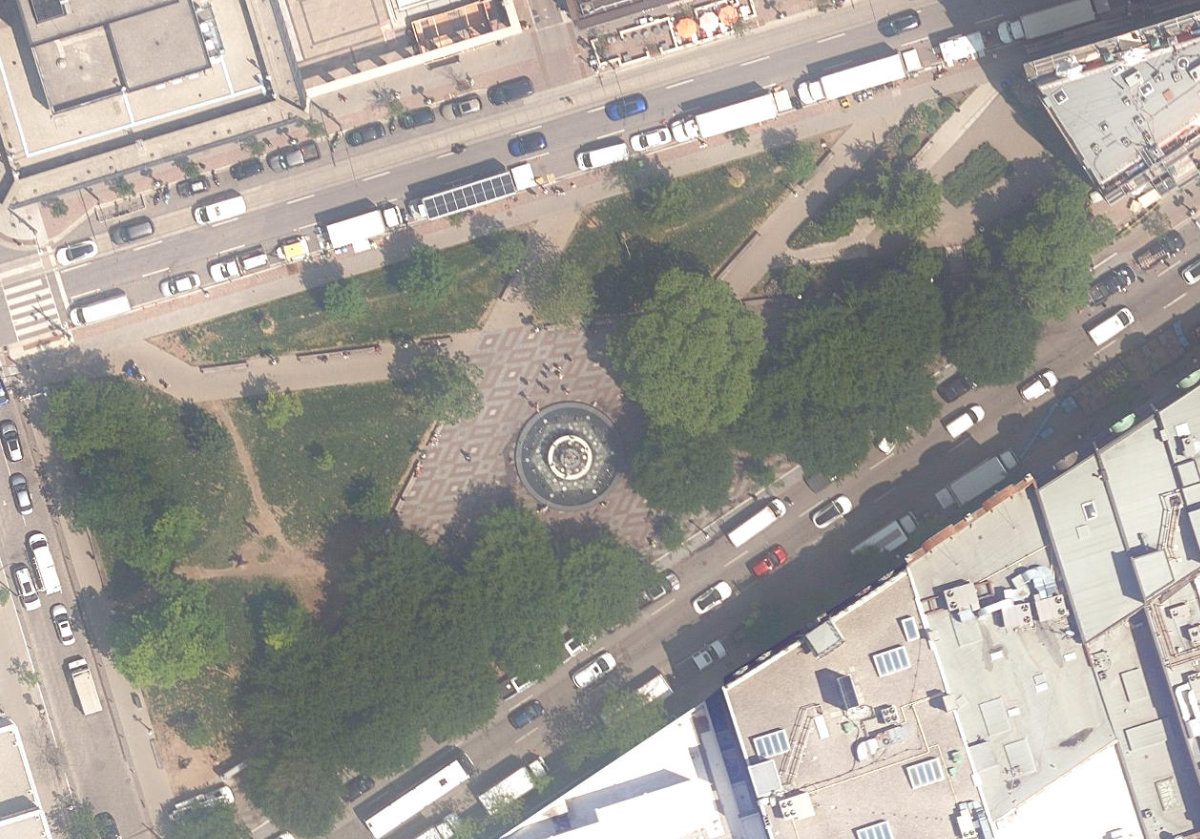
Explain this score
Where did the 59 come from? Each weighted contribution against a neutral 50 baseline. Green = pushed up; red = pulled down.
Sum of contributions = the headline score. A negative bar means that dimension dragged the park below the city-wide neutral baseline.
Why this park works
Berczy Park works because its edge activation score (73) is one of the city's strongest and its connectivity (80) is also top decile (its perimeter is lined with active uses).
What limits this park
Berczy Park doesn't have a clear weakness. Every measured dimension is at or above the middle of the pack.
Most distinctive characteristic
Most distinctive feature: exceptionally high edge activation (73, top decile).
Jacobs reading
Berczy Park is a balanced hybrid: strong urban integration (72) and meaningful natural comfort (66). Rare in the Toronto Park Catalogue.
Tradeoffs
- Connectivity (80) significantly outpaces natural comfort (52): well placed in the city but offers little shade or ecological respite.
Performance in context
- This park is a strong overperformer for its cohort: raw 59 versus an expected 42 for similar parks (small Civic Square) (gap +17).
Typology classification
Classified as Civic Square: tower-walled, low canopy (12%), tight frontage: reads as a civic square
Edge Activation
Within 100 m of the park edge: 50 active uses (cafe, restaurant, retail, transit_stop) and 2 dead/hostile uses (parking_lot). Active edges keep "eyes on the park" through the day; parking lots, blank institutional walls, rail and highway frontages drain street life.
Source: OSM POIs (amenity/shop) + Toronto Building Footprints + land use
Connectivity
Connectivity blends paths, intersections, transit, entrances, and edge density. This park has 11 mapped paths/walkways and 23 sidewalk segments within 50 m; 18 street intersections within 100 m; 56 transit stops within a 400 m walk; 7 estimated access points across ~294 m of perimeter. edge density is healthy, no superblock penalty. Source coverage: centreline, pedestrian_network, transit_osm.
Source: Toronto Centreline V2 + Pedestrian Network + OSM transit stops
Amenity Diversity
No amenities recorded. Score is 0 until inventory is loaded.
Source: Toronto Parks & Recreation Facilities + OSM amenity tags
Natural Comfort
Natural-comfort components for this park: 12.0% estimated tree canopy; nearest waterbody ~691 m; 18 city-mapped trees inside the polygon (18.0/ha). Reading: exposed. Source coverage: treed_area, waterbodies, street_trees. Impervious surface is approximated (Toronto's authoritative layer ships only as a raster GeoTIFF).
Source: Toronto Treed Area + Ravine + Waterbodies + Street Tree Inventory
Enclosure / Eyes on Park
64 buildings within 25 m of the park edge (24 mid-rise, 5 low-rise, 35 tower); avg edge height 84.6 m (~28 floors); 21.8 buildings per 100 m of 294 m perimeter (strong frontage density); edges dominated by towers; 35 towers ≥ 40 m within 25 m of the edge. "Eyes on the park" come strongest from the 24 mid-rise edge buildings.
Source: Toronto 3D Massing (building footprints + heights)
Border Vacuum Risk
Park edges face the city. No significant border vacuum detected.
Source: Toronto Street Centreline (highways) + rail layer + OSM landuse + building footprints
Equity Context
Equity Context requires inputs not yet loaded for this park (Toronto Neighbourhood Profiles). Score is held at a neutral 50 with low confidence. Read with caution.
Source: Toronto Neighbourhood Profiles
Amenities (0)
No amenities recorded for this park.
Nearby active-edge features (80)
- restaurant: Power Up Game Bar22 m
- restaurant: Uncle Tony's22 m
- restaurant: east thirty-six22 m
- restaurant: Sukho Thai22 m
- restaurant: Pravda Vodka House22 m
- restaurant: The Resevoir Lounge23 m
- retail: Allan Parss Salon23 m
- restaurant: Quiznos24 m
- cafe: Tim Hortons26 m
- restaurant: BiBab Express Sushi N Rolls30 m
- restaurant: Fran's Restaurant30 m
- retail: Winners31 m
- restaurant: Fresh Kitchen + Juice Bar33 m
- restaurant: The Sultan's Tent34 m
- restaurant: CC Lounge and Whiskey Bar34 m
- restaurant: The Flatiron36 m
- cafe: Café Moroc39 m
- cafe: Aroma Espresso Bar39 m
- retail: Step Up Massage & Rehab48 m
- restaurant: Greenbox53 m
- restaurant: Biff's53 m
- parking lot54 m
- retail61 m
- transit stop: Wellington Street East63 m
- cafe: Tim Hortons64 m
- retail67 m
- restaurant: The Place69 m
- parking lot70 m
- retail71 m
- cafe: Mofer Coffee Front St72 m
- restaurant: D. W. Alexander72 m
- restaurant: Woods73 m
- retail: O Sole Salon & Spa73 m
- restaurant: Cantina Mercatto73 m
- retail: Bulloch Tailors74 m
- restaurant: Chadani74 m
- restaurant: Pat Quinn Lounge74 m
- restaurant: P.J. O'Brien Restaurant75 m
- restaurant: Piano Piano75 m
- retail75 m
- retail: Beauty Supply Outlet76 m
- retail78 m
- retail: Wildlife Thrift Store78 m
- retail: Richie Neighbourhood Store81 m
- restaurant: C'est What?83 m
- restaurant: Subway83 m
- retail: St. Lawrence Eye Care85 m
- restaurant: Hothouse Restaurant & Bar85 m
- transit stop: Scott Street85 m
- retail: Valet Service Cleaners90 m
- restaurant: The Berczy Tavern94 m
- restaurant: Amano Trattoria96 m
- restaurant: The Joneses102 m
- restaurant: Ceci Bar104 m
- restaurant: Pi Co.108 m
- retail: Red Rock108 m
- transit stop: Yonge Street111 m
- retail111 m
- transit stop: Yonge Street112 m
- transit stop: Wellington Street West115 m
- cafe: Third Wave Coffee Inc.118 m
- restaurant: Duke's Refresher120 m
- highway: Yonge Street124 m
- restaurant: The Keg125 m
- retail: Woven Treasures Gallery126 m
- restaurant: The Tilted Kilt126 m
- restaurant: Shoeless Joe's126 m
- retail: Front Street Florist126 m
- restaurant: The Old Spaghetti Factory127 m
- restaurant: Amsterdam Bicycle Club127 m
- restaurant: Goose Island Brewhouse127 m
- restaurant: Scotland Yard128 m
- retail: Flight Centre128 m
- retail: Canna Cabana131 m
- transit stop: Front Street East132 m
- retail: Metro133 m
- highway: Yonge Street133 m
- transit stop: Wellington Street West134 m
- transit stop: Front Street West136 m
- parking lot137 m
Park profile
Five-axis radar across the structural dimensions.
Citywide percentile ranks
Across all Toronto parks in the dataset.
- Overall vitality99th
- Edge activation99th
- Connectivity99th
- Amenity diversity51th
- Natural comfort64th
- Enclosure55th
Most similar parks
Closest in metric space across the five structural dimensions.
- Marie Baldwin ParkCorridor / Linear Park53
- Gibson ParkCivic Square50
- Valleyfield ParkWaterfront Park56
- Trinity SquareCivic Square55
- OLD CITY HALL - Building GroundsCivic Square53
Most opposite parks
Furthest in metric space. Useful for recognising what kind of park this isn’t.
- Trca Lands ( 26)Ravine / Naturalized Park27
- Toronto Islands - Muggs Island ParkRavine / Naturalized Park25
- Rouge ParkRavine / Naturalized Park26
- Rouge ParkRavine / Naturalized Park21
- Rouge ParkRavine / Naturalized Park28
Visitor signals
Public attention measured by Google Places aggregates. This proxies attention, not occupancy. Aggregate-only: no usernames, no review text, no extra photos beyond the cached hero.
“Tree-lined park featuring an open plaza with a 2-tiered fountain with dog & cat sculptures.” (Google editorial summary)
p100 citywide · p97 within Civic Square
Source: Google Places API · match unverified (0.00 composite confidence) · last refreshed 5/9/2026. Privacy contract. Measures public attention, not occupancy.
Human activity signals: not available
No activity signals have landed for this park yet. The model has scored its physical form but it can’t yet say how often it’s programmed, photographed, or walked through. See /data-ethics for what we will and will not collect.
Does this score feel accurate?
Your read of Berczy Parkmatters. We’re testing whether the model lines up with how people actually use the park. Submissions are stored locally; no account needed.
Tell us how this park feels
We measure structure (canopy, edges, connectivity). You measure feeling. Both matter, and disagreement is itself useful civic data.
What would improve this park?
Generated from the weakest measured dimensions: a starting point, not a prescription.
- Diversify what people can do in the park (playground, washroom, water, shade, performance, sport, garden): even small additions raise this score.
Data sources
- City of Toronto Open Data: Parks (Green Space)Polygon boundaries, official names, types.
- Parks & Recreation FacilitiesInventory of in-park amenities (washrooms, fields, rinks…).
- Toronto Pedestrian NetworkSidewalk segments around and through parks; estimated park entrances.
- Toronto Centreline V2Street segments + intersection nodes near park edges; trails and walkways.
- Toronto 3D MassingBuilding footprints + heights for edge-building counts, frontage density, and tower-in-the-park risk.
- Toronto Treed AreaTree canopy share inside park polygons via stratified-grid sampling.
- Toronto Waterbodies & RiversWater surface inside parks + nearest-water distance for cooling.
- Ravine & Natural Feature ProtectionRavine overlap as a cooling / natural-comfort signal.
- Toronto Street Tree InventoryTree count + density inside park polygons.
- Neighbourhood Profiles(Pending) Equity context proxy.
- OpenStreetMap (Overpass API)Cafés, restaurants, retail, transit stops, parking, highways, rail.