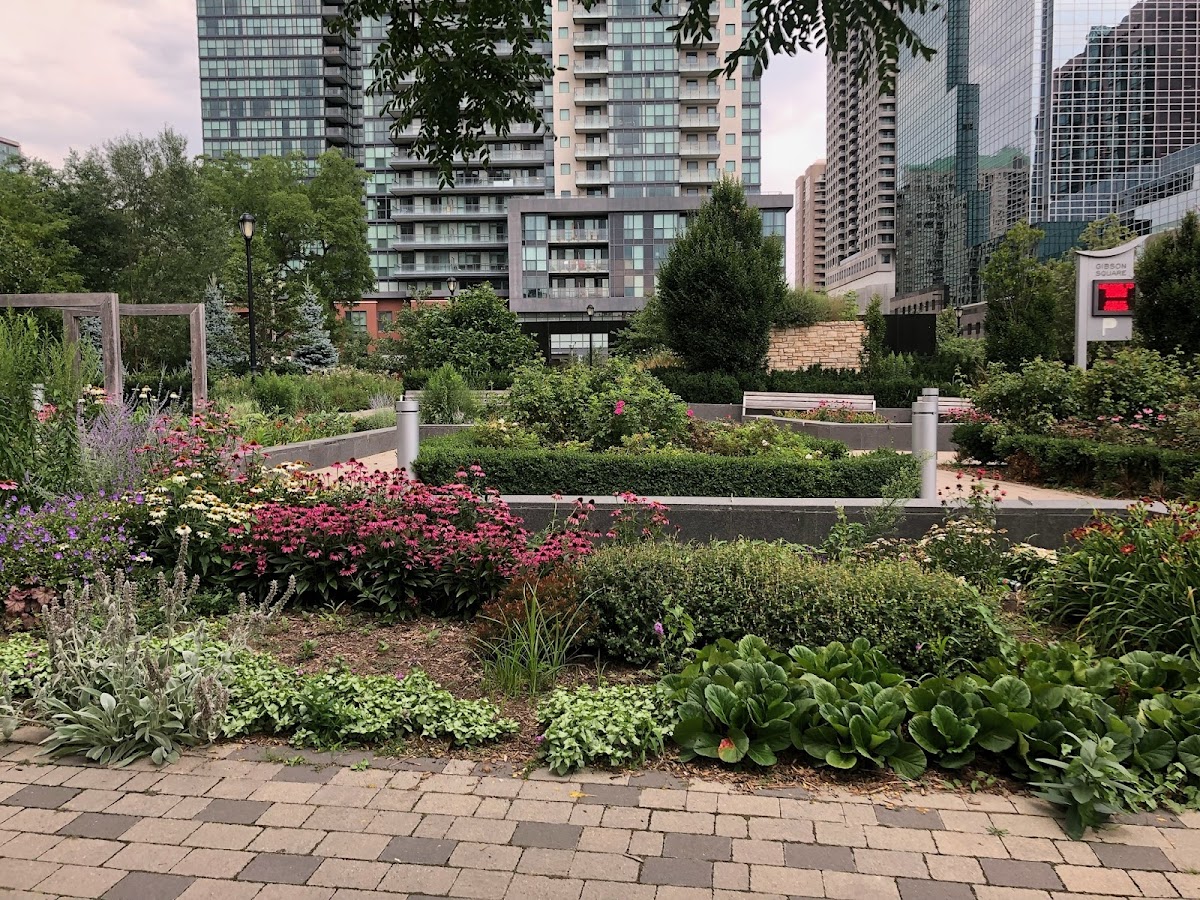
Gibson Park
Civic Square, one of the city's strongest overall (score 50, rank ~96th percentile). Strongest: edge activation; weakest: amenity diversity.
Photo by Janice Wong via Google Places · cached 5/9/2026
Gibson Park scores 50.4 / 100. Strongest dimensions: connectivity and enclosure / eyes on park. Weakest: amenity diversity (0). Border-vacuum risk is low. This score is a transparent reading of Jane Jacobs-style vitality factors, not a definitive judgment.
Area · 0.59 ha
Weighted across six dimensions · confidence 59%
Scores are not bell-curved. Percentiles and expected scores provide context without changing the underlying model.
Loading map…
The parks map is loading.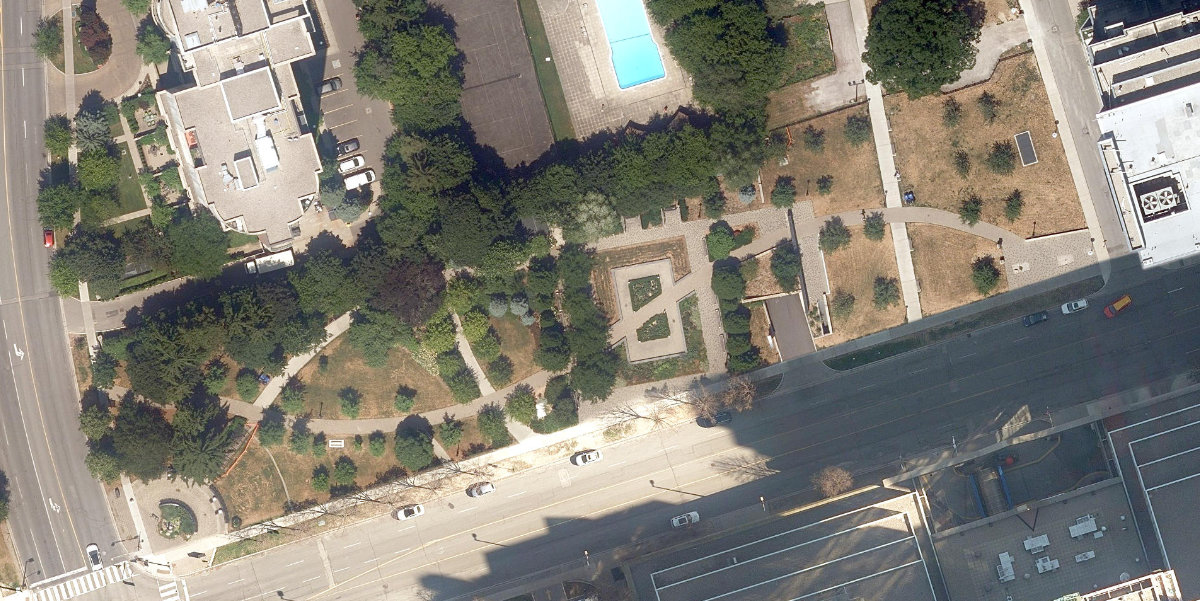
Explain this score
Where did the 50 come from? Each weighted contribution against a neutral 50 baseline. Green = pushed up; red = pulled down.
Sum of contributions = the headline score. A negative bar means that dimension dragged the park below the city-wide neutral baseline.
Why this park works
Gibson Park works because its edge activation score (56) is one of the city's strongest and its connectivity (75) is also top decile (its perimeter is lined with active uses).
What limits this park
Gibson Park doesn't have a clear weakness. Every measured dimension is at or above the middle of the pack.
Most distinctive characteristic
Most distinctive feature: exceptionally high edge activation (56, top decile).
Jacobs reading
Gibson Park sits between an urban social park and an ecological retreat: moderately useful for both, exceptionally suited to neither.
Tradeoffs
- Connectivity (75) significantly outpaces natural comfort (44): well placed in the city but offers little shade or ecological respite.
- 26 nearby towers cast wind and shadow without contributing canopy: passive surveillance is plentiful but human-scale comfort is not.
Performance in context
- A modest overperformer for its civic square typology (+9 vs the median in small Civic Square).
Typology classification
Classified as Civic Square: tower-walled, low canopy (0%), tight frontage: reads as a civic square
Edge Activation
Within 100 m of the park edge: 24 active uses (community, transit_stop, restaurant, retail, cafe) and 3 dead/hostile uses (parking_lot). Active edges keep "eyes on the park" through the day; parking lots, blank institutional walls, rail and highway frontages drain street life.
Source: OSM POIs (amenity/shop) + Toronto Building Footprints + land use
Connectivity
Connectivity blends paths, intersections, transit, entrances, and edge density. This park has 35 mapped paths/walkways and 12 sidewalk segments within 50 m; 10 street intersections within 100 m; 13 transit stops within a 400 m walk; 10 estimated access points across ~462 m of perimeter. edge density is healthy, no superblock penalty. Source coverage: centreline, pedestrian_network, transit_osm.
Source: Toronto Centreline V2 + Pedestrian Network + OSM transit stops
Amenity Diversity
No amenities recorded. Score is 0 until inventory is loaded.
Source: Toronto Parks & Recreation Facilities + OSM amenity tags
Natural Comfort
Natural-comfort components for this park: ~10.5% effective canopy (0.0% from contiguous tree polygons + scattered tree density); nearest waterbody ~1057 m; 15 city-mapped trees inside the polygon (15.0/ha). Reading: exposed. Source coverage: waterbodies, street_trees. Impervious surface is approximated (Toronto's authoritative layer ships only as a raster GeoTIFF).
Source: Toronto Treed Area + Ravine + Waterbodies + Street Tree Inventory
Enclosure / Eyes on Park
55 buildings within 25 m of the park edge (13 mid-rise, 16 low-rise, 26 tower); avg edge height 63.5 m (~21 floors); 11.9 buildings per 100 m of 462 m perimeter (strong frontage density); edges dominated by towers; 26 towers ≥ 40 m within 25 m of the edge. "Eyes on the park" come strongest from the 13 mid-rise edge buildings.
Source: Toronto 3D Massing (building footprints + heights)
Border Vacuum Risk
Border-vacuum factors within 50 m of the park: parking_lot. Jacobs warned that highways, rail, parking lots and blank institutional edges act as "vacuums" that suppress foot traffic and isolate the park from its neighbourhood.
Source: Toronto Street Centreline (highways) + rail layer + OSM landuse + building footprints
Equity Context
Equity Context requires inputs not yet loaded for this park (Toronto Neighbourhood Profiles). Score is held at a neutral 50 with low confidence. Read with caution.
Source: Toronto Neighbourhood Profiles
Amenities (0)
No amenities recorded for this park.
Nearby active-edge features (77)
- parking lot24 m
- restaurant: Trio 335 m
- cafe: Aroma Espresso Bar36 m
- retail: Taya38 m
- cafe: Centre Cafe45 m
- retail: Centrestage Hair Design & Beauty Products51 m
- retail: City Centre Convenience53 m
- retail: Geneva Fine Jewellery & Watches56 m
- retail: Quattro Boutique57 m
- retail: Fido57 m
- retail: Jazz Casuals61 m
- parking lot65 m
- retail: Palm Tree75 m
- restaurant: La Prep76 m
- cafe: Second Cup76 m
- retail: Midnight Sun Tanning Salon76 m
- restaurant: Villa Fruit78 m
- restaurant: Cafe Palma79 m
- retail83 m
- retail: La Memoire84 m
- parking lot86 m
- restaurant: California Thai89 m
- restaurant: Boston Pizza91 m
- community: Toronto Public Library - North York Central Library94 m
- transit stop: Yonge Street at Park Home Avenue94 m
- transit stop: North York City Centre Entrance94 m
- retail: Flight Centre98 m
- retail: Book Ends106 m
- highway: Yonge Street114 m
- highway: Yonge Street116 m
- parking lot117 m
- highway: Yonge Street122 m
- transit stop: Yonge Street at Empress Avenue122 m
- retail: PetSmart131 m
- transit stop: North York Centre132 m
- school: Shining Through Centre133 m
- retail: Tavazo Dried Nuts & Fruits133 m
- restaurant: Morals Village133 m
- transit stop: Mel Lastman Square Entrance135 m
- transit stop: North York Centre135 m
- retail: Pet Valu139 m
- cafe: Starbucks140 m
- transit stop: Yonge Street at Hillcrest Avenue142 m
- highway: Yonge Street144 m
- cafe: A Corner Cafe145 m
- retail: LCBO147 m
- transit stop: Yonge St. @ North York Blvd. (Mel Lastman Square)147 m
- cafe: Ten Ren's Tea150 m
- retail: Lucullus152 m
- restaurant152 m
- highway: Yonge Street152 m
- retail: North York Ink153 m
- parking lot153 m
- retail: Elysia Beauty Bar156 m
- restaurant: Wendy's157 m
- retail: Pixel Ink Tattoo160 m
- transit stop: Empress Walk Entrance161 m
- retail: Hermosa Medical Esthetics162 m
- retail: Mumuso163 m
- cafe: ITS TEA167 m
- retail: Value Mobile168 m
- retail: Walking on a Cloud169 m
- restaurant: Good Taste Casserole Rice170 m
- parking lot170 m
- retail: Dollarama171 m
- restaurant: Daldongnae Korean BBQ174 m
- restaurant: Petit Potato178 m
- retail: Ardene178 m
- parking lot182 m
- parking lot182 m
- cafe: Second Cup185 m
- retail: Empress Optical186 m
- retail: Shefield & Sons187 m
- highway: Yonge Street191 m
- parking lot192 m
- parking lot192 m
- parking lot200 m
Park profile
Five-axis radar across the structural dimensions.
Citywide percentile ranks
Across all Toronto parks in the dataset.
- Overall vitality96th
- Edge activation97th
- Connectivity95th
- Amenity diversity36th
- Natural comfort46th
- Enclosure37th
Most similar parks
Closest in metric space across the five structural dimensions.
- Marie Baldwin ParkCorridor / Linear Park53
- East Highland Creek WatercourseRavine / Naturalized Park48
- Don Panos ParketteParkette44
- Charles Brereton ParkParkette48
- Queens Quay Traffic IslandWaterfront Park46
Most opposite parks
Furthest in metric space. Useful for recognising what kind of park this isn’t.
- Trca Lands ( 26)Ravine / Naturalized Park27
- Toronto Islands - Muggs Island ParkRavine / Naturalized Park25
- Rouge ParkRavine / Naturalized Park26
- Rouge ParkRavine / Naturalized Park28
- Rouge ParkWaterfront Park25
Visitor signals
Public attention measured by Google Places aggregates. This proxies attention, not occupancy. Aggregate-only: no usernames, no review text, no extra photos beyond the cached hero.
p40 citywide · p24 within Civic Square
Source: Google Places API · match high (0.96 composite confidence) · last refreshed 5/9/2026. Privacy contract. Measures public attention, not occupancy.
Human activity signals: not available
No activity signals have landed for this park yet. The model has scored its physical form but it can’t yet say how often it’s programmed, photographed, or walked through. See /data-ethics for what we will and will not collect.
Does this score feel accurate?
Your read of Gibson Parkmatters. We’re testing whether the model lines up with how people actually use the park. Submissions are stored locally; no account needed.
Tell us how this park feels
We measure structure (canopy, edges, connectivity). You measure feeling. Both matter, and disagreement is itself useful civic data.
What would improve this park?
Generated from the weakest measured dimensions: a starting point, not a prescription.
- Diversify what people can do in the park (playground, washroom, water, shade, performance, sport, garden): even small additions raise this score.
- Increase canopy and reduce paved area. Shade and water features extend usable hours and seasons.
Data sources
- City of Toronto Open Data: Parks (Green Space)Polygon boundaries, official names, types.
- Parks & Recreation FacilitiesInventory of in-park amenities (washrooms, fields, rinks…).
- Toronto Pedestrian NetworkSidewalk segments around and through parks; estimated park entrances.
- Toronto Centreline V2Street segments + intersection nodes near park edges; trails and walkways.
- Toronto 3D MassingBuilding footprints + heights for edge-building counts, frontage density, and tower-in-the-park risk.
- Toronto Treed AreaTree canopy share inside park polygons via stratified-grid sampling.
- Toronto Waterbodies & RiversWater surface inside parks + nearest-water distance for cooling.
- Ravine & Natural Feature ProtectionRavine overlap as a cooling / natural-comfort signal.
- Toronto Street Tree InventoryTree count + density inside park polygons.
- Neighbourhood Profiles(Pending) Equity context proxy.
- OpenStreetMap (Overpass API)Cafés, restaurants, retail, transit stops, parking, highways, rail.