Queens Quay Traffic Island
Waterfront Park, in the top tier overall (score 46, rank ~90th percentile). Strongest: edge activation; weakest: natural comfort.
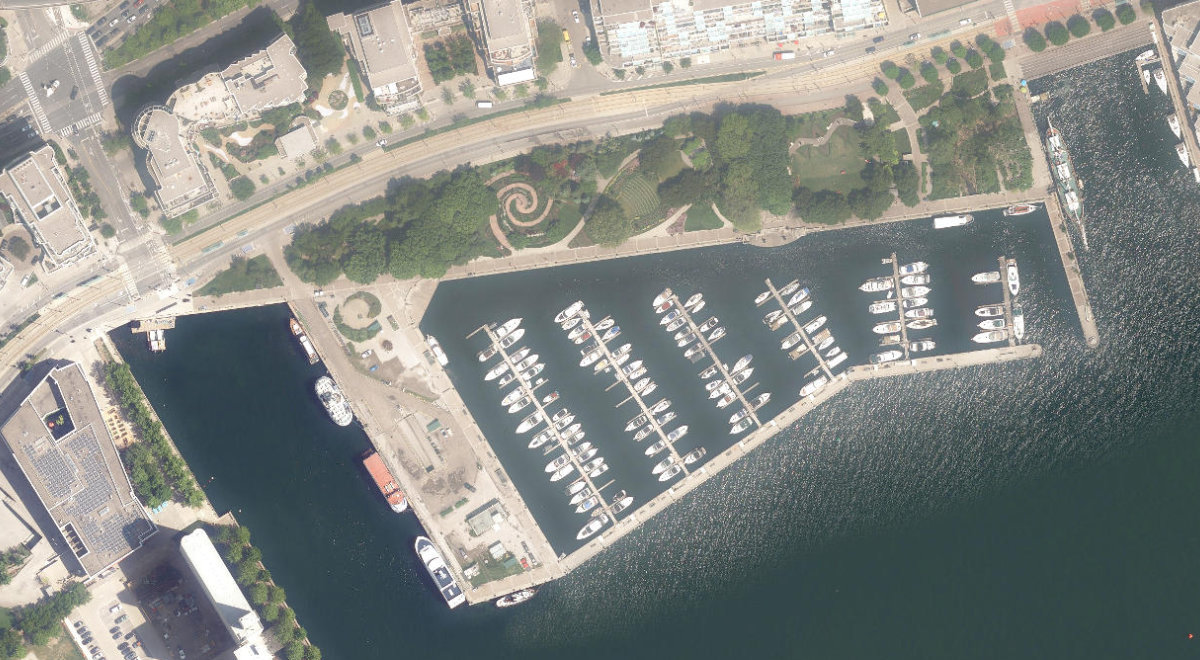
Aerial, City of Toronto orthophoto, ~8 cm/px source · cached 5/9/2026
Queens Quay Traffic Island scores 45.6 / 100. Strongest dimensions: connectivity and enclosure / eyes on park. Weakest: amenity diversity (0). Border-vacuum risk is low. This score is a transparent reading of Jane Jacobs-style vitality factors, not a definitive judgment.
Area · 0.75 ha
Weighted across six dimensions · confidence 56%
Scores are not bell-curved. Percentiles and expected scores provide context without changing the underlying model.
Loading map…
The parks map is loading.Explain this score
Where did the 46 come from? Each weighted contribution against a neutral 50 baseline. Green = pushed up; red = pulled down.
Sum of contributions = the headline score. A negative bar means that dimension dragged the park below the city-wide neutral baseline.
Why this park works
Queens Quay Traffic Island works because its edge activation score (51) is one of the city's strongest and its connectivity (65) is also top quartile (its perimeter is lined with active uses).
What limits this park
Queens Quay Traffic Island is held back by natural comfort (34, bottom quartile): only 0% canopy means little summer shade.
Most distinctive characteristic
Most distinctive feature: exceptionally high edge activation (51, top decile).
Jacobs reading
Queens Quay Traffic Island sits between an urban social park and an ecological retreat: moderately useful for both, exceptionally suited to neither.
Tradeoffs
- Connectivity (65) significantly outpaces natural comfort (34): well placed in the city but offers little shade or ecological respite.
- 5 nearby towers cast wind and shadow without contributing canopy: passive surveillance is plentiful but human-scale comfort is not.
Performance in context
- This park is a strong overperformer for its cohort: raw 46 versus an expected 30 for similar parks (small Waterfront Park waterfront) (gap +15).
Typology classification
Classified as Waterfront Park: 18% water surface inside park. Secondary read: Corridor / Linear Park (shape elongation 6.2× a circle of equal area).
Edge Activation
Within 100 m of the park edge: 29 active uses (transit_stop, retail, restaurant, school, community, cafe) and 4 dead/hostile uses (parking_lot, highway). Active edges keep "eyes on the park" through the day; parking lots, blank institutional walls, rail and highway frontages drain street life.
Source: OSM POIs (amenity/shop) + Toronto Building Footprints + land use
Connectivity
Connectivity blends paths, intersections, transit, entrances, and edge density. This park has 66 mapped paths/walkways and 21 sidewalk segments within 50 m; 4 street intersections within 100 m; 14 transit stops within a 400 m walk; 15 estimated access points across ~1,914 m of perimeter. low edge density, significant superblock penalty applied. Source coverage: centreline, pedestrian_network, transit_osm.
Source: Toronto Centreline V2 + Pedestrian Network + OSM transit stops
Amenity Diversity
No amenities recorded. Score is 0 until inventory is loaded.
Source: Toronto Parks & Recreation Facilities + OSM amenity tags
Natural Comfort
Natural-comfort components for this park: 0.0% estimated tree canopy; 18.2% water surface. Reading: water-cooled. Source coverage: waterbodies. Impervious surface is approximated (Toronto's authoritative layer ships only as a raster GeoTIFF).
Source: Toronto Treed Area + Ravine + Waterbodies + Street Tree Inventory
Enclosure / Eyes on Park
44 buildings within 25 m of the park edge (34 mid-rise, 5 low-rise, 5 tower); avg edge height 27.4 m (~9 floors); 2.3 buildings per 100 m of 1,914 m perimeter (moderate frontage density); edges lean tall but still framed; 5 towers ≥ 40 m within 25 m of the edge. "Eyes on the park" come strongest from the 34 mid-rise edge buildings.
Source: Toronto 3D Massing (building footprints + heights)
Border Vacuum Risk
Border-vacuum factors within 50 m of the park: Marina Parking. Jacobs warned that highways, rail, parking lots and blank institutional edges act as "vacuums" that suppress foot traffic and isolate the park from its neighbourhood.
Source: Toronto Street Centreline (highways) + rail layer + OSM landuse + building footprints
Equity Context
Equity Context requires inputs not yet loaded for this park (Toronto Neighbourhood Profiles). Score is held at a neutral 50 with low confidence. Read with caution.
Source: Toronto Neighbourhood Profiles
Amenities (0)
No amenities recorded for this park.
Nearby active-edge features (63)
- parking lot: Marina Parking15 m
- transit stop: Dan Leckie Way25 m
- transit stop: Dan Leckie Way28 m
- retail34 m
- restaurant: Maguro House36 m
- transit stop: Spadina Avenue40 m
- restaurant: Subway41 m
- restaurant: Iruka Sushi42 m
- retail: Mike the Ticket Host44 m
- restaurant: Blomboon Restaurant & Bar48 m
- retail: Lincare Dry Cleaners Ltd.53 m
- community: Waterfront Neighbourhood Centre57 m
- retail: Ride One59 m
- retail: Omnya Health61 m
- school: City School65 m
- transit stop: Spadina Avenue71 m
- retail: Lakeview Tower Beauty Salon Nails & Spa72 m
- retail: Snatched TO74 m
- transit stop: Spadina Avenue/Queens Quay West74 m
- transit stop: Queens Quay West, Billy Bishop Airport76 m
- retail: Lakeview Convenience80 m
- retail: Cosmopawlitan81 m
- retail: Duende Beauty Salon81 m
- retail: RP Nails81 m
- retail: Harbourfront Eye Care82 m
- cafe: Music Garden Cafe82 m
- retail: Solace Tanning Studios82 m
- retail: Edible Arrangements83 m
- retail: Salon 500 Hair and Esthetics83 m
- retail: Hildas Cleaners89 m
- parking lot91 m
- highway: Lake Shore Boulevard West92 m
- parking lot95 m
- transit stop: Queens Quay Loop at Lower Spadina Ave101 m
- highway: Lake Shore Boulevard West107 m
- highway: Lake Shore Boulevard West108 m
- highway: Lake Shore Boulevard West109 m
- school: Milne Acting Studio109 m
- highway: Lake Shore Boulevard West109 m
- highway: Lake Shore Boulevard West113 m
- highway: Lake Shore Boulevard West117 m
- highway: Lake Shore Boulevard West118 m
- highway: Lake Shore Boulevard West119 m
- highway: Lake Shore Boulevard West123 m
- highway: Lake Shore Boulevard West124 m
- retail: T.O. Tuck Shop134 m
- highway: Lake Shore Boulevard West135 m
- highway: Lake Shore Boulevard West139 m
- parking lot147 m
- retail: Dream Cyclery153 m
- transit stop: Bathurst Street, Billy Bishop Airport160 m
- highway: Lake Shore Boulevard West163 m
- retail: Harbour Green Farms168 m
- highway: Gardiner Expressway173 m
- highway: Lake Shore Boulevard West173 m
- retail: Sculpture Nails and Spa174 m
- retail: Convenience Store & Dry Cleaning178 m
- highway: Lake Shore Boulevard West179 m
- highway: Gardiner Expressway180 m
- highway: Gardiner Expressway180 m
- highway: Lake Shore Boulevard West183 m
- retail: Loblaws191 m
- highway: Lake Shore Boulevard West193 m
Park profile
Five-axis radar across the structural dimensions.
Citywide percentile ranks
Across all Toronto parks in the dataset.
- Overall vitality90th
- Edge activation96th
- Connectivity82th
- Amenity diversity42th
- Natural comfort18th
- Enclosure40th
Most similar parks
Closest in metric space across the five structural dimensions.
- GEORGE SYME COMMUNITY SCHOOL - Building GroundsNeighbourhood Park42
- Scarborough Hydro Green SpaceNeighbourhood Park44
- North York Hydro Green SpaceNeighbourhood Park47
- Tabor Hill Memorial ParkCivic Square44
- Scarborough Hydro Green SpaceNeighbourhood Park48
Most opposite parks
Furthest in metric space. Useful for recognising what kind of park this isn’t.
- Trca Lands ( 26)Ravine / Naturalized Park27
- Toronto Islands - Muggs Island ParkRavine / Naturalized Park25
- Rouge ParkRavine / Naturalized Park28
- Rouge ParkRavine / Naturalized Park26
- Rouge ParkWaterfront Park25
Human activity signals: not available
No activity signals have landed for this park yet. The model has scored its physical form but it can’t yet say how often it’s programmed, photographed, or walked through. See /data-ethics for what we will and will not collect.
Does this score feel accurate?
Your read of Queens Quay Traffic Islandmatters. We’re testing whether the model lines up with how people actually use the park. Submissions are stored locally; no account needed.
Tell us how this park feels
We measure structure (canopy, edges, connectivity). You measure feeling. Both matter, and disagreement is itself useful civic data.
What would improve this park?
Generated from the weakest measured dimensions: a starting point, not a prescription.
- Diversify what people can do in the park (playground, washroom, water, shade, performance, sport, garden): even small additions raise this score.
- Increase canopy and reduce paved area. Shade and water features extend usable hours and seasons.
Data sources
- City of Toronto Open Data: Parks (Green Space)Polygon boundaries, official names, types.
- Parks & Recreation FacilitiesInventory of in-park amenities (washrooms, fields, rinks…).
- Toronto Pedestrian NetworkSidewalk segments around and through parks; estimated park entrances.
- Toronto Centreline V2Street segments + intersection nodes near park edges; trails and walkways.
- Toronto 3D MassingBuilding footprints + heights for edge-building counts, frontage density, and tower-in-the-park risk.
- Toronto Treed AreaTree canopy share inside park polygons via stratified-grid sampling.
- Toronto Waterbodies & RiversWater surface inside parks + nearest-water distance for cooling.
- Ravine & Natural Feature ProtectionRavine overlap as a cooling / natural-comfort signal.
- Toronto Street Tree InventoryTree count + density inside park polygons.
- Neighbourhood Profiles(Pending) Equity context proxy.
- OpenStreetMap (Overpass API)Cafés, restaurants, retail, transit stops, parking, highways, rail.