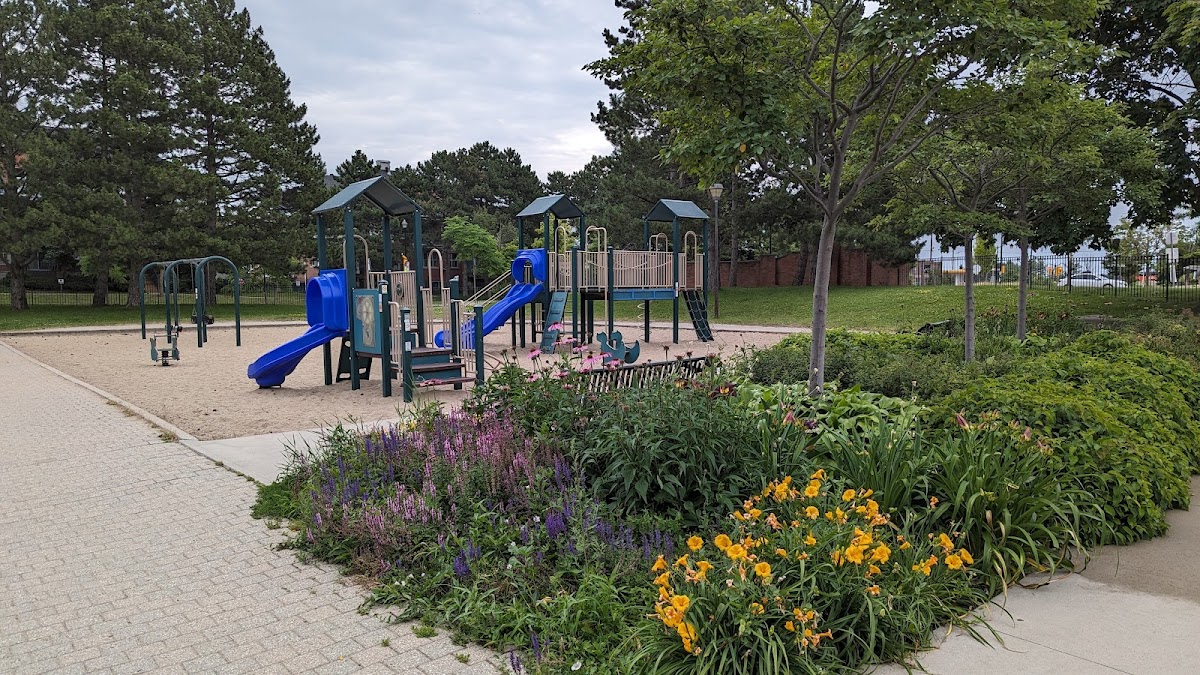
Tall Pines Park
Athletic / Recreation Park, above average overall (score 42, rank ~83th percentile). Strongest: amenity diversity; weakest: edge activation.
Photo by Kazi Sabbir Ibna Ataur via Google Places · cached 5/9/2026
Tall Pines Park scores 42.1 / 100. Strongest dimensions: enclosure / eyes on park and connectivity. Weakest: edge activation (0.7). Border-vacuum risk is low. This score is a transparent reading of Jane Jacobs-style vitality factors, not a definitive judgment.
Area · 1.19 ha
Weighted across six dimensions · confidence 72%
Scores are not bell-curved. Percentiles and expected scores provide context without changing the underlying model.
Loading map…
The parks map is loading.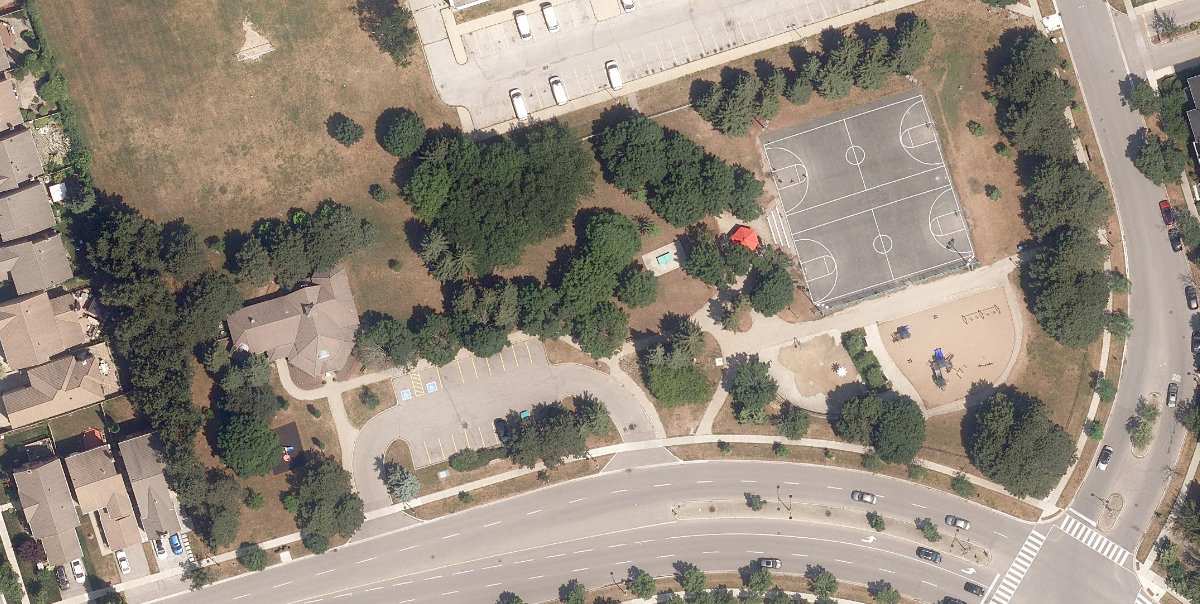
Explain this score
Where did the 42 come from? Each weighted contribution against a neutral 50 baseline. Green = pushed up; red = pulled down.
Sum of contributions = the headline score. A negative bar means that dimension dragged the park below the city-wide neutral baseline.
Why this park works
Tall Pines Park works because its amenity diversity score (28) is in the top tier and its connectivity (67) is also top quartile.
What limits this park
.
Most distinctive characteristic
Most distinctive feature: exceptionally high amenity diversity (28, top decile).
Jacobs reading
Tall Pines Park sits between an urban social park and an ecological retreat: moderately useful for both, exceptionally suited to neither.
Tradeoffs
- The park is enclosed by buildings (75) but the surrounding streets are quiet (edge activation 1): frame without animation.
Performance in context
- Citywide rank is high (83rd) but typology rank is more modest (54th): the strength likely comes from the dataset average pulling lower than this typology’s baseline.
Typology classification
Classified as Athletic / Recreation Park: 67% of amenity types are athletic (basketball, tennis). Secondary read: Neighbourhood Park (1.2 ha, framed by 10 mid-rise vs 0 towers).
Edge Activation
Within 100 m of the park edge: 11 active uses (retail, restaurant, transit_stop) and 8 dead/hostile uses (parking_lot). Active edges keep "eyes on the park" through the day; parking lots, blank institutional walls, rail and highway frontages drain street life.
Source: OSM POIs (amenity/shop) + Toronto Building Footprints + land use
Connectivity
Connectivity blends paths, intersections, transit, entrances, and edge density. This park has 17 mapped paths/walkways and 16 sidewalk segments within 50 m; 6 street intersections within 100 m; 9 transit stops within a 400 m walk; 6 estimated access points across ~505 m of perimeter. edge density is healthy, no superblock penalty. Source coverage: centreline, pedestrian_network, transit_osm.
Source: Toronto Centreline V2 + Pedestrian Network + OSM transit stops
Amenity Diversity
3 distinct amenity types in the park (basketball, playground, tennis). Diversity, not raw count, drives the score so a park with many distinct activity types can outrank a larger park that repeats the same use.
Source: Toronto Parks & Recreation Facilities + OSM amenity tags
Natural Comfort
Natural-comfort components for this park: 12.2% estimated tree canopy; nearest waterbody ~575 m; 21 city-mapped trees inside the polygon (17.6/ha). Reading: exposed. Source coverage: treed_area, waterbodies, street_trees. Impervious surface is approximated (Toronto's authoritative layer ships only as a raster GeoTIFF).
Source: Toronto Treed Area + Ravine + Waterbodies + Street Tree Inventory
Enclosure / Eyes on Park
40 buildings within 25 m of the park edge (10 mid-rise, 30 low-rise, 0 tower); avg edge height 7.3 m (~2 floors); 7.9 buildings per 100 m of 505 m perimeter (strong frontage density); edges are low-rise (mostly 2 to 3 floors); no towers immediately adjacent. "Eyes on the park" come strongest from the 10 mid-rise edge buildings.
Source: Toronto 3D Massing (building footprints + heights)
Border Vacuum Risk
Border-vacuum factors within 50 m of the park: parking_lot, parking_lot. Jacobs warned that highways, rail, parking lots and blank institutional edges act as "vacuums" that suppress foot traffic and isolate the park from its neighbourhood.
Source: Toronto Street Centreline (highways) + rail layer + OSM landuse + building footprints
Equity Context
Equity Context requires inputs not yet loaded for this park (Toronto Neighbourhood Profiles). Score is held at a neutral 50 with low confidence. Read with caution.
Source: Toronto Neighbourhood Profiles
Amenities (3 types · 3 records)
- basketball
- playground
- tennis
Nearby active-edge features (56)
- parking lot0 m
- parking lot16 m
- retail: Optical 20/2049 m
- retail: Freedom Mobile50 m
- retail: QS Nails Salon51 m
- parking lot58 m
- restaurant: Popeyes70 m
- retail: Spyder Vapes76 m
- transit stop: Rylander Boulevard at Kingston Road79 m
- parking lot79 m
- retail: Images Salon80 m
- parking lot82 m
- retail: The Hearing Clinic83 m
- parking lot83 m
- restaurant: Eggsmart88 m
- parking lot90 m
- retail: Dollarama91 m
- restaurant: Subway93 m
- parking lot95 m
- retail: Sherwin-Williams101 m
- parking lot105 m
- parking lot108 m
- parking lot112 m
- restaurant: Mucho Burrito115 m
- parking lot116 m
- retail: Classic Fireplace and BBQ Store117 m
- restaurant: Port Union Seafood118 m
- cafe: Starbucks118 m
- restaurant: Wimpy's Diner121 m
- retail: Pet Valu132 m
- retail: Expedia CruiseShipCentres136 m
- retail: A Touch of Beauty Hair Salon136 m
- retail: Transformational Barbers136 m
- retail: Aztec Tanning137 m
- parking lot139 m
- retail: Hair Wave139 m
- retail: Cheerful Dry Cleaners & Alteration140 m
- retail: Emerald Cleaners142 m
- retail: Lamana's Italian Bakery144 m
- retail: Luv Dem Nails147 m
- retail: Rogers149 m
- highway: Kingston Road153 m
- highway: Kingston Road153 m
- parking lot160 m
- highway: Kingston Road161 m
- parking lot: DriveTest road test parking only162 m
- highway: Kingston Road165 m
- highway: Kingston Road166 m
- highway: Kingston Road167 m
- parking lot168 m
- retail: sunshine variety176 m
- retail: TNS Health Store179 m
- highway: Kingston Road185 m
- highway: Kingston Road188 m
- parking lot196 m
- parking lot198 m
Park profile
Five-axis radar across the structural dimensions.
Citywide percentile ranks
Across all Toronto parks in the dataset.
- Overall vitality83th
- Edge activation63th
- Connectivity86th
- Amenity diversity95th
- Natural comfort64th
- Enclosure76th
Most similar parks
Closest in metric space across the five structural dimensions.
- Amos Waites ParkNeighbourhood Park35
- Lambton ParkRavine / Naturalized Park32
- Kempton Howard ParkAthletic / Recreation Park43
- Orchard ParkNeighbourhood Park45
- Stephenson ParkAthletic / Recreation Park41
Most opposite parks
Furthest in metric space. Useful for recognising what kind of park this isn’t.
- Simcoe ParkTower-Community Green Space51
- Queen'S Quay Traffic IslandWaterfront Park49
- Market Lane ParkUrban Plaza63
- Toronto Islands - Muggs Island ParkRavine / Naturalized Park25
- Trca Lands ( 26)Ravine / Naturalized Park27
Visitor signals
Public attention measured by Google Places aggregates. This proxies attention, not occupancy. Aggregate-only: no usernames, no review text, no extra photos beyond the cached hero.
p18 citywide · p13 within Athletic / Recreation Park
Source: Google Places API · match medium (0.62 composite confidence) · last refreshed 5/9/2026. Privacy contract. Measures public attention, not occupancy.
Human activity signals: not available
No activity signals have landed for this park yet. The model has scored its physical form but it can’t yet say how often it’s programmed, photographed, or walked through. See /data-ethics for what we will and will not collect.
Does this score feel accurate?
Your read of Tall Pines Parkmatters. We’re testing whether the model lines up with how people actually use the park. Submissions are stored locally; no account needed.
Tell us how this park feels
We measure structure (canopy, edges, connectivity). You measure feeling. Both matter, and disagreement is itself useful civic data.
What would improve this park?
Generated from the weakest measured dimensions: a starting point, not a prescription.
- Activate the edges: encourage cafés, retail or community uses on the streets that face the park; replace blank or parking-lot edges where possible.
- Diversify what people can do in the park (playground, washroom, water, shade, performance, sport, garden): even small additions raise this score.
Data sources
- City of Toronto Open Data: Parks (Green Space)Polygon boundaries, official names, types.
- Parks & Recreation FacilitiesInventory of in-park amenities (washrooms, fields, rinks…).
- Toronto Pedestrian NetworkSidewalk segments around and through parks; estimated park entrances.
- Toronto Centreline V2Street segments + intersection nodes near park edges; trails and walkways.
- Toronto 3D MassingBuilding footprints + heights for edge-building counts, frontage density, and tower-in-the-park risk.
- Toronto Treed AreaTree canopy share inside park polygons via stratified-grid sampling.
- Toronto Waterbodies & RiversWater surface inside parks + nearest-water distance for cooling.
- Ravine & Natural Feature ProtectionRavine overlap as a cooling / natural-comfort signal.
- Toronto Street Tree InventoryTree count + density inside park polygons.
- Neighbourhood Profiles(Pending) Equity context proxy.
- OpenStreetMap (Overpass API)Cafés, restaurants, retail, transit stops, parking, highways, rail.