Hto Park
Waterfront Park, middle of the pack overall (score 38, rank ~68th percentile). Strongest: edge activation; weakest: enclosure.
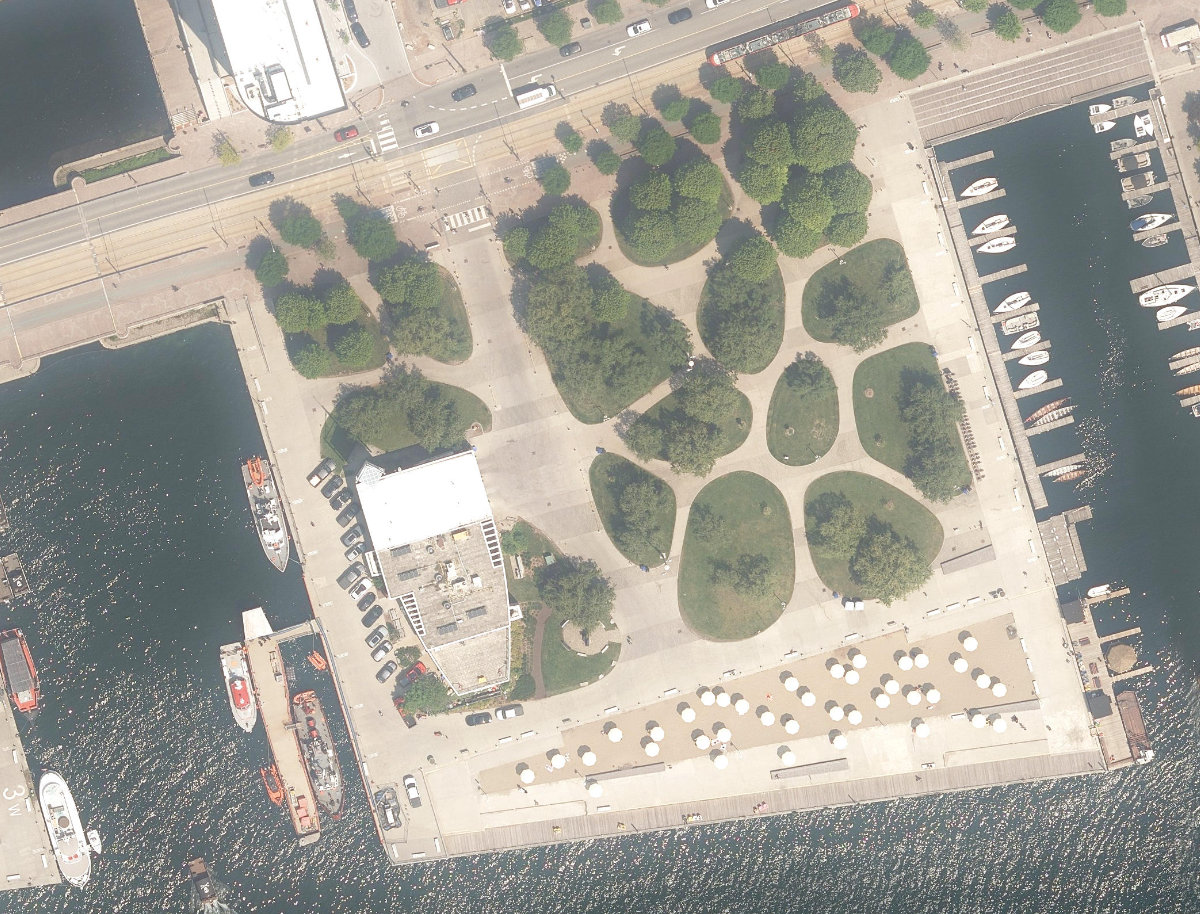
Aerial, City of Toronto orthophoto, ~8 cm/px source · cached 5/9/2026
Hto Park scores 38 / 100. Strongest dimensions: enclosure / eyes on park and edge activation. Weakest: amenity diversity (0). Border-vacuum risk is low. This score is a transparent reading of Jane Jacobs-style vitality factors, not a definitive judgment.
Area · 1.58 ha
Weighted across six dimensions · confidence 59%
Scores are not bell-curved. Percentiles and expected scores provide context without changing the underlying model.
Loading map…
The parks map is loading.Explain this score
Where did the 38 come from? Each weighted contribution against a neutral 50 baseline. Green = pushed up; red = pulled down.
Sum of contributions = the headline score. A negative bar means that dimension dragged the park below the city-wide neutral baseline.
Why this park works
Hto Park works because its edge activation score (41) is in the top tier.
What limits this park
Hto Park is held back by enclosure (55, bottom quartile).
Most distinctive characteristic
Most distinctive feature: exceptionally high edge activation (41, top decile).
Jacobs reading
Hto Park sits between an urban social park and an ecological retreat: moderately useful for both, exceptionally suited to neither.
Tradeoffs
- 6 nearby towers cast wind and shadow without contributing canopy: passive surveillance is plentiful but human-scale comfort is not.
Performance in context
- A modest overperformer for its waterfront park typology (+8 vs the median in medium Waterfront Park waterfront).
Typology classification
Classified as Waterfront Park: nearest waterbody within ~60 m
Edge Activation
Within 100 m of the park edge: 8 active uses (restaurant, retail, transit_stop) and 2 dead/hostile uses (parking_lot). Active edges keep "eyes on the park" through the day; parking lots, blank institutional walls, rail and highway frontages drain street life.
Source: OSM POIs (amenity/shop) + Toronto Building Footprints + land use
Connectivity
Connectivity blends paths, intersections, transit, entrances, and edge density. This park has 1 mapped paths/walkways and 7 sidewalk segments within 50 m; 2 street intersections within 100 m; 7 transit stops within a 400 m walk; 0 estimated access points across ~554 m of perimeter. low edge density, significant superblock penalty applied. Source coverage: centreline, pedestrian_network, transit_osm.
Source: Toronto Centreline V2 + Pedestrian Network + OSM transit stops
Amenity Diversity
No amenities recorded. Score is 0 until inventory is loaded.
Source: Toronto Parks & Recreation Facilities + OSM amenity tags
Natural Comfort
Natural-comfort components for this park: ~1.8% effective canopy (0.0% from contiguous tree polygons + scattered tree density); nearest waterbody ~60 m; 4 city-mapped trees inside the polygon (2.5/ha). Reading: water-cooled. Source coverage: waterbodies, street_trees. Impervious surface is approximated (Toronto's authoritative layer ships only as a raster GeoTIFF).
Source: Toronto Treed Area + Ravine + Waterbodies + Street Tree Inventory
Enclosure / Eyes on Park
16 buildings within 25 m of the park edge (4 mid-rise, 6 low-rise, 6 tower); avg edge height 30.7 m (~10 floors); 2.9 buildings per 100 m of 554 m perimeter (moderate frontage density); edges lean tall but still framed; 6 towers ≥ 40 m within 25 m of the edge. "Eyes on the park" come strongest from the 4 mid-rise edge buildings.
Source: Toronto 3D Massing (building footprints + heights)
Border Vacuum Risk
Park edges face the city. No significant border vacuum detected.
Source: Toronto Street Centreline (highways) + rail layer + OSM landuse + building footprints
Equity Context
Equity Context requires inputs not yet loaded for this park (Toronto Neighbourhood Profiles). Score is held at a neutral 50 with low confidence. Read with caution.
Source: Toronto Neighbourhood Profiles
Amenities (0)
No amenities recorded for this park.
Nearby active-edge features (40)
- transit stop: Rees Street45 m
- retail51 m
- parking lot: Harbourfront Parking Lot P355 m
- retail: Sculpture Nails and Spa67 m
- parking lot73 m
- retail: Dream Cyclery74 m
- restaurant: I Love Churros75 m
- transit stop: Rees Street75 m
- retail: Convenience Store & Dry Cleaning76 m
- restaurant: Porticello Restaurant80 m
- retail: Wheel Excitement Inc.101 m
- parking lot102 m
- cafe: Tim Hortons105 m
- highway: Lake Shore Boulevard West107 m
- highway: Gardiner Expressway108 m
- restaurant: Pizzaiolo109 m
- highway: Lake Shore Boulevard West114 m
- restaurant: Mamma Pizza118 m
- retail: Hildas Cleaners135 m
- restaurant: Harvey's136 m
- restaurant: Swiss Chalet140 m
- transit stop: Spadina Avenue/Queens Quay West141 m
- highway: Gardiner Expressway141 m
- retail: Lakeview Convenience143 m
- highway: Lake Shore Boulevard West143 m
- restaurant: Shoeless Joe's147 m
- parking lot151 m
- highway: Lake Shore Boulevard West152 m
- retail: Lakeview Tower Beauty Salon Nails & Spa153 m
- retail: The UPS Store156 m
- restaurant: Golden Egg Restaurant160 m
- cafe: Café Locale165 m
- highway: Gardiner Expressway171 m
- cafe: Bubble Baby173 m
- restaurant: Indian Roti House177 m
- retail: Harbour Nails184 m
- retail: Value Buds187 m
- transit stop: Queens Quay Loop at Lower Spadina Ave193 m
- highway: Lake Shore Boulevard West195 m
- retail: Rabba198 m
Park profile
Five-axis radar across the structural dimensions.
Citywide percentile ranks
Across all Toronto parks in the dataset.
- Overall vitality68th
- Edge activation93th
- Connectivity24th
- Amenity diversity54th
- Natural comfort30th
- Enclosure20th
Most similar parks
Closest in metric space across the five structural dimensions.
- Downsview Subway Station GreenNeighbourhood Park38
- Etobicoke Hydro Green SpaceCorridor / Linear Park40
- BATHURST QUAY PARKS YARD - Building GroundsWaterfront Park38
- Friars Lane BoulevardParkette39
- City Wide Open SpaceParkette38
Most opposite parks
Furthest in metric space. Useful for recognising what kind of park this isn’t.
- High ParkRavine / Naturalized Park47
- Ramsden ParkRavine / Naturalized Park43
- Earlscourt ParkNeighbourhood Park44
- Christie Pits ParkRavine / Naturalized Park44
- Withrow ParkNeighbourhood Park50
Human activity signals: not available
No activity signals have landed for this park yet. The model has scored its physical form but it can’t yet say how often it’s programmed, photographed, or walked through. See /data-ethics for what we will and will not collect.
Does this score feel accurate?
Your read of Hto Parkmatters. We’re testing whether the model lines up with how people actually use the park. Submissions are stored locally; no account needed.
Tell us how this park feels
We measure structure (canopy, edges, connectivity). You measure feeling. Both matter, and disagreement is itself useful civic data.
What would improve this park?
Generated from the weakest measured dimensions: a starting point, not a prescription.
- Activate the edges: encourage cafés, retail or community uses on the streets that face the park; replace blank or parking-lot edges where possible.
- Add or open more entrances and improve sidewalk continuity around the park. More permeability means more spontaneous use.
- Diversify what people can do in the park (playground, washroom, water, shade, performance, sport, garden): even small additions raise this score.
- Increase canopy and reduce paved area. Shade and water features extend usable hours and seasons.
Data sources
- City of Toronto Open Data: Parks (Green Space)Polygon boundaries, official names, types.
- Parks & Recreation FacilitiesInventory of in-park amenities (washrooms, fields, rinks…).
- Toronto Pedestrian NetworkSidewalk segments around and through parks; estimated park entrances.
- Toronto Centreline V2Street segments + intersection nodes near park edges; trails and walkways.
- Toronto 3D MassingBuilding footprints + heights for edge-building counts, frontage density, and tower-in-the-park risk.
- Toronto Treed AreaTree canopy share inside park polygons via stratified-grid sampling.
- Toronto Waterbodies & RiversWater surface inside parks + nearest-water distance for cooling.
- Ravine & Natural Feature ProtectionRavine overlap as a cooling / natural-comfort signal.
- Toronto Street Tree InventoryTree count + density inside park polygons.
- Neighbourhood Profiles(Pending) Equity context proxy.
- OpenStreetMap (Overpass API)Cafés, restaurants, retail, transit stops, parking, highways, rail.