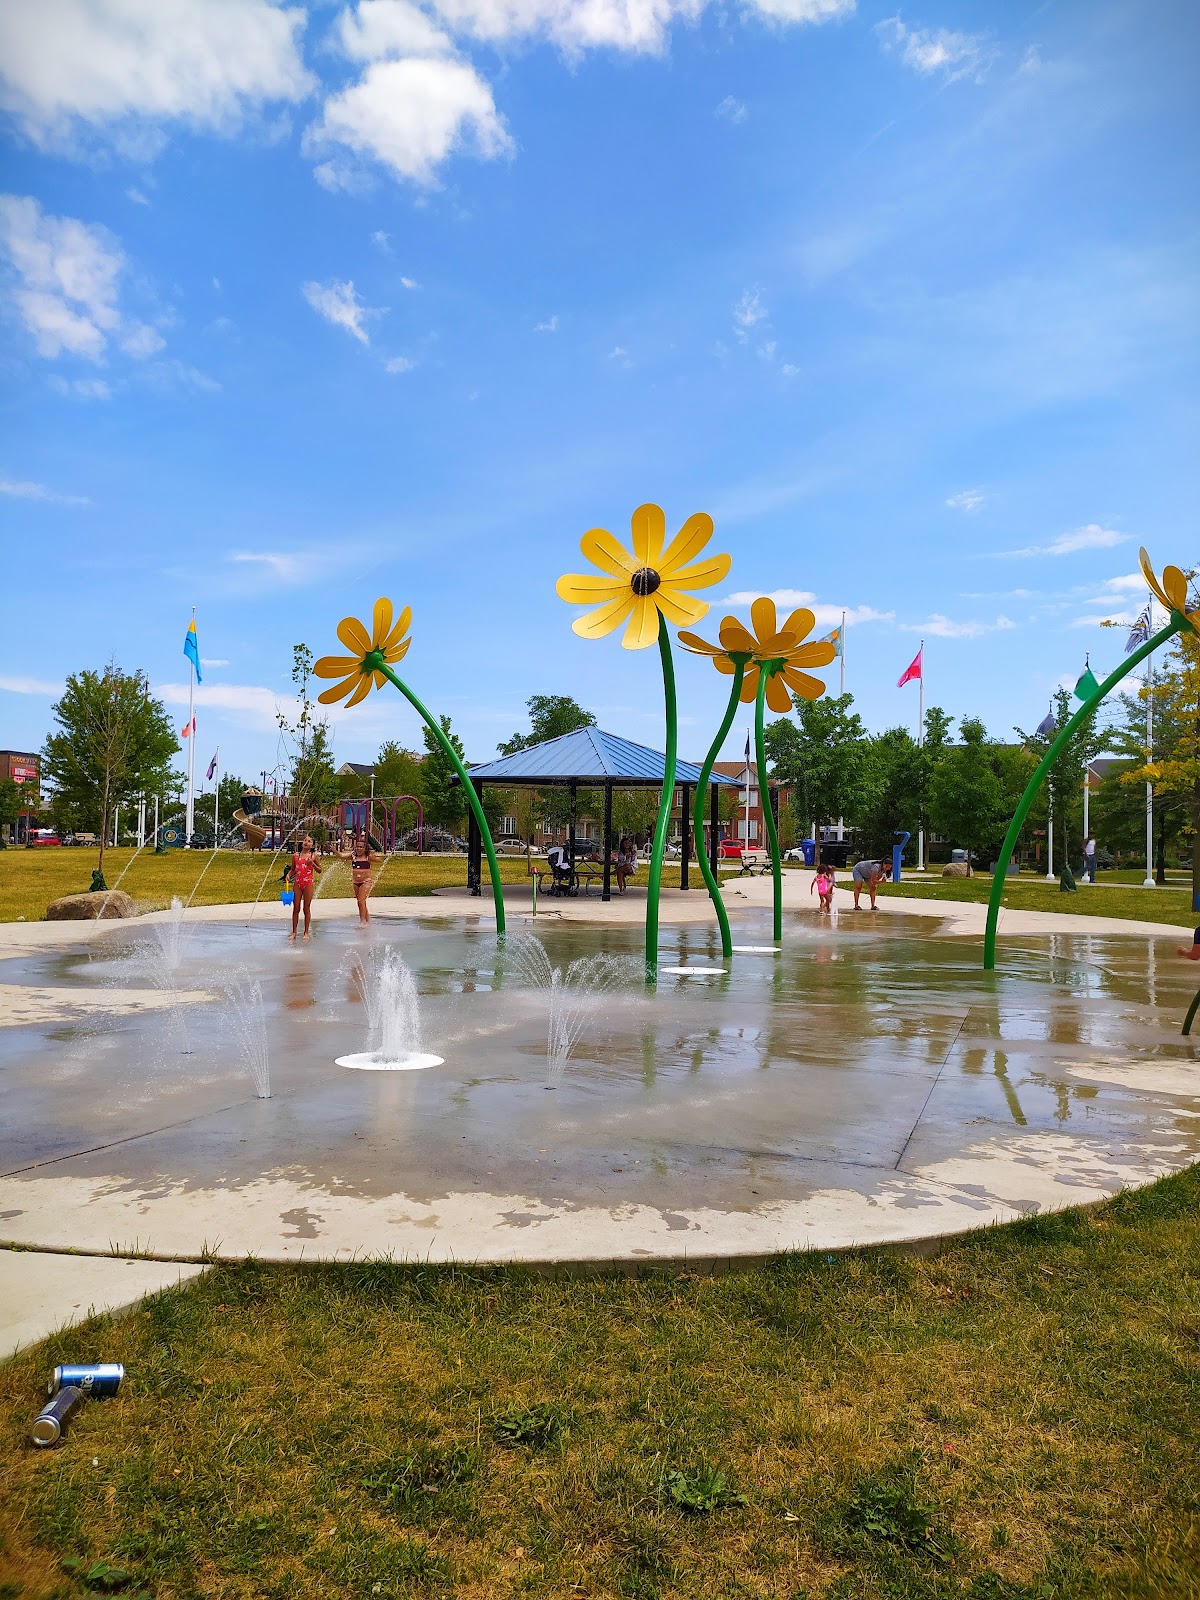
Maple Claire Park
Neighbourhood Park, one of the city's strongest overall (score 60, rank ~99th percentile). Strongest: edge activation; weakest: natural comfort.
Photo by Francisco Naranjo via Google Places · cached 5/9/2026
Maple Claire Park scores 60.2 / 100. Strongest dimensions: enclosure / eyes on park and connectivity. Weakest: amenity diversity (46.1). Border-vacuum risk is low. This score is a transparent reading of Jane Jacobs-style vitality factors, not a definitive judgment.
Area · 1.14 ha
What's here
Getting around
198 m of mapped path, 100% paved.
No steps mapped on the path network.
Typically 13 m to the nearest bench, and 37 m at the far end.
Nearest parking 116 m away. None of the 2 nearby lots records whether it has accessible spaces.
Path, seating and parking data comes from OpenStreetMap and reflects what volunteers have mapped, not a survey. Absence here means nobody has recorded it. This section does not assess wheelchair access: the relevant OpenStreetMap tag is present on well under 1% of Toronto paths.
Weighted across six dimensions · confidence 68%
Data confidence: moderate
Scores are not bell-curved. Percentiles and expected scores provide context without changing the underlying model.
Loading map…
The parks map is loading.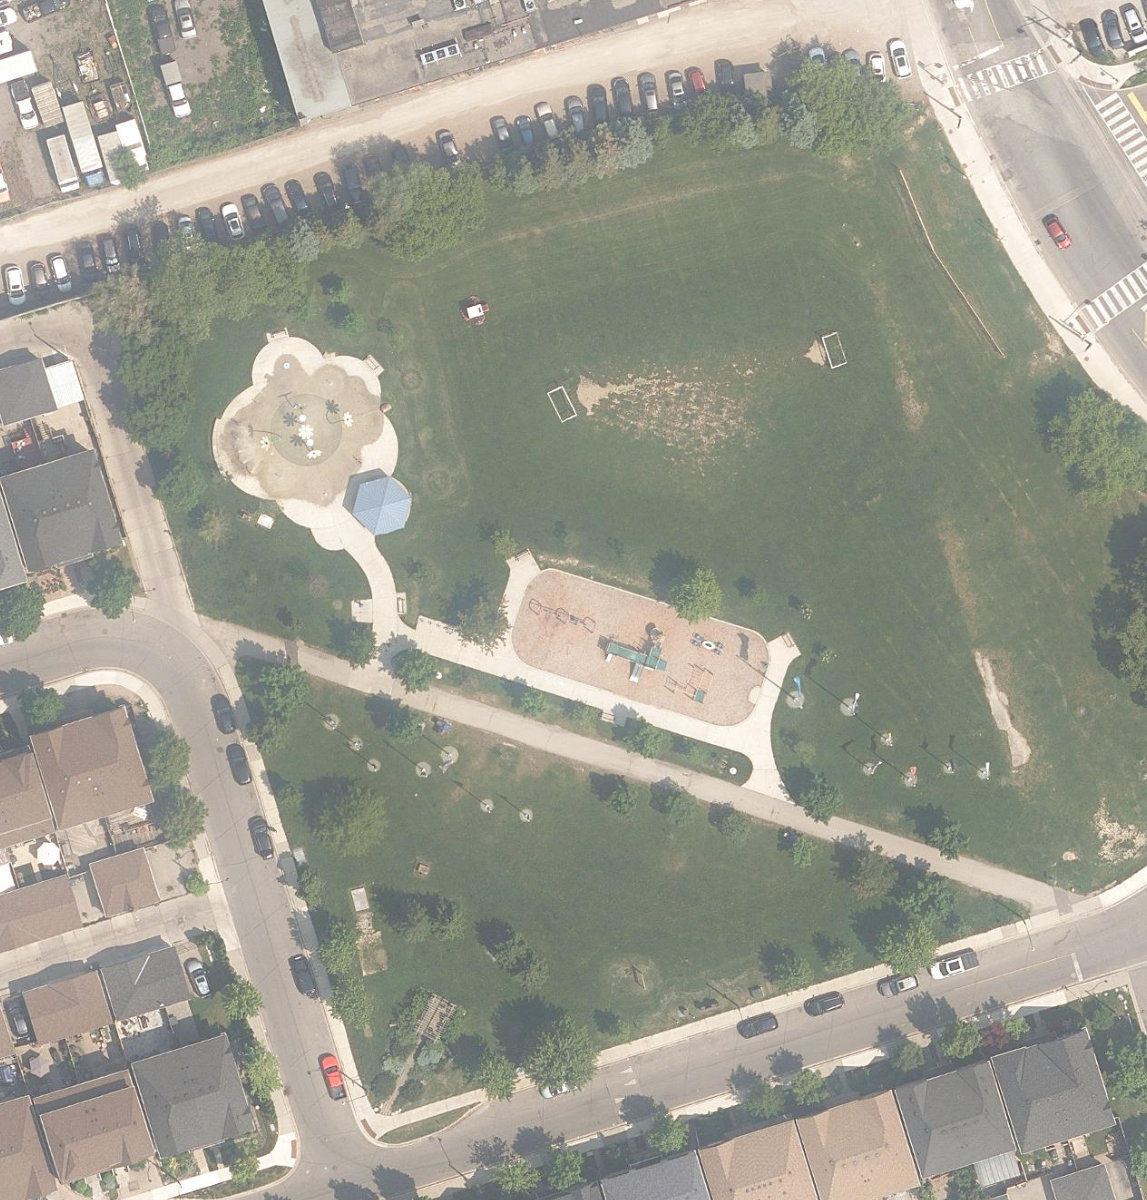
Boundary: OpenStreetMap contributors (ODbL).
Explain this score
Where did the 60 come from? Each weighted contribution against a neutral 50 baseline. Green = pushed up; red = pulled down.
Sum of contributions = the headline score. A negative bar means that dimension dragged the park below the city-wide neutral baseline.
Why this park works
Maple Claire Park works because its edge activation score (54) is one of the city's strongest and its amenity diversity (46) is also top decile (its perimeter is lined with active uses).
What limits this park
Maple Claire Park doesn't have a clear weakness. Every measured dimension is at or above the middle of the pack.
Most distinctive characteristic
Most distinctive feature: exceptionally high edge activation (54, top decile).
Jacobs reading
Maple Claire Park sits between an urban social park and an ecological retreat: moderately useful for both, exceptionally suited to neither.
Tradeoffs
- Strong physical conditions (score 60) but weak observed activity signals (9). The model says this should work, but events, mentions, and counters say it isn't being used at the level the urban form would predict.
Performance in context
- This park is a strong overperformer for its cohort: raw 60 versus an expected 39 for similar parks (medium Neighbourhood Park) (gap +21).
Typology classification
Classified as Neighbourhood Park: 1.1 ha, framed by 2 mid-rise vs 0 towers
Edge Activation
Within 100 m of the park edge: 7 active uses (transit_stop, restaurant, retail) and 0 dead/hostile uses (none). Active edges keep "eyes on the park" through the day; parking lots, blank institutional walls, rail and highway frontages drain street life.
Source: OSM POIs (amenity/shop) + Toronto Building Footprints + land use
Connectivity
Connectivity blends paths, intersections, transit, entrances, and edge density. This park has 4 mapped paths/walkways and 16 sidewalk segments within 50 m; 7 street intersections within 100 m; 18 transit stops within a 400 m walk; 3 estimated access points across ~419 m of perimeter. edge density is healthy, no superblock penalty. Source coverage: centreline, pedestrian_network, transit_osm.
Source: Toronto Centreline V2 + Pedestrian Network + OSM transit stops
Amenity Diversity
7 distinct amenity types in the park (playground, art, bench, drinking_water, picnic, shelter, …). Diversity, not raw count, drives the score so a park with many distinct activity types can outrank a larger park that repeats the same use.
Source: Toronto Parks & Recreation Facilities + OSM amenity tags
Natural Comfort
Natural-comfort components for this park: ~16.6% effective canopy (0.0% from contiguous tree polygons + scattered tree density); nearest waterbody ~321 m; 27 city-mapped trees inside the polygon (23.8/ha). Reading: exposed. Source coverage: waterbodies, street_trees. Impervious surface is approximated (Toronto's authoritative layer ships only as a raster GeoTIFF).
Source: Toronto Treed Area + Ravine + Waterbodies + Street Tree Inventory
Enclosure / Eyes on Park
56 buildings within 25 m of the park edge (2 mid-rise, 54 low-rise, 0 tower); avg edge height 6.9 m (~2 floors); 13.4 buildings per 100 m of 419 m perimeter (strong frontage density); edges are low-rise (mostly 2 to 3 floors); no towers immediately adjacent. "Eyes on the park" come strongest from the 2 mid-rise edge buildings.
Source: Toronto 3D Massing (building footprints + heights)
Border Vacuum Risk
Park edges face the city. No significant border vacuum detected.
Source: Toronto Street Centreline (highways) + rail layer + OSM landuse + building footprints
Equity Context
Equity Context requires inputs not yet loaded for this park (Toronto Neighbourhood Profiles). Score is held at a neutral 50 with low confidence. Read with caution.
Source: Toronto Neighbourhood Profiles
Amenities (7 types · 13 records)
- playground
- art
- bench
- drinking water
- picnic
- shelter
- sports field
Nearby active-edge features (44)
- restaurant: Victory's Kitchen29 m
- transit stop: Gunn's Loop53 m
- transit stop: Gunn's Loop64 m
- restaurant: Shoeless Joe's81 m
- retail: Nations Fresh Foods83 m
- transit stop: Gunn's Road91 m
- retail: C Wave Optical98 m
- transit stop: Old Stock Yards101 m
- retail: Telus/Koodo108 m
- restaurant: A&W110 m
- retail: Walking on a Cloud112 m
- retail: Zwilling113 m
- retail: Ardene115 m
- retail: La Vie en Rose115 m
- parking lot116 m
- retail: Sally Beauty119 m
- retail: Popeye's Supplements121 m
- cafe: Marry Me Mochi121 m
- retail: The Children's Place122 m
- retail: Canadian Tire125 m
- transit stop: Old Stock Yards125 m
- retail: The Shoe Company126 m
- retail: Sephora126 m
- retail: First Choice HairCutters131 m
- retail: Snuggle Bugz132 m
- restaurant: Tahini’s138 m
- retail: Roots141 m
- restaurant: Halibut House144 m
- restaurant: Mr. Puff’s Dessert Bar146 m
- restaurant: Mary Brown's153 m
- retail: Pet Valu161 m
- retail: Carter's OshKosh168 m
- restaurant: Panda Express171 m
- retail: Bell173 m
- parking lot: Garage South174 m
- retail: Winners174 m
- retail: Marshalls178 m
- retail: Men Zone Barbershop179 m
- retail: Nails for You182 m
- retail: LCBO185 m
- restaurant: Sunset Grill188 m
- cafe: Chatime191 m
- restaurant: Firehouse Subs191 m
- cafe: Tim Hortons198 m
Park profile
Five-axis radar across the structural dimensions.
Citywide percentile ranks
Across all Toronto parks in the dataset.
- Overall vitality99th
- Edge activation97th
- Connectivity84th
- Amenity diversity95th
- Natural comfort65th
- Enclosure70th
Most similar parks
Closest in metric space across the five structural dimensions.
- WATERFRONT NEIGHBOURHOOD CENTRE - Building GroundsWaterfront Park57
- Art Eggleton ParkUrban Plaza61
- Trace Manes ParkNeighbourhood Park59
- Westgrove ParkAthletic / Recreation Park59
- Skymark ParkOther58
Most opposite parks
Furthest in metric space. Useful for recognising what kind of park this isn’t.
- Trca Lands ( 26)Ravine / Naturalized Park27
- Toronto Islands - Muggs Island ParkRavine / Naturalized Park25
- Rouge ParkRavine / Naturalized Park28
- Rouge ParkWaterfront Park25
- Rouge ParkRavine / Naturalized Park26
Visitor signals
Public attention measured by Google Places aggregates. This proxies attention, not occupancy. Aggregate-only: no usernames, no review text, no extra photos beyond the cached hero.
p72 citywide · p67 within Neighbourhood Park
Source: Google Places API · match high (0.97 composite confidence) · last refreshed 5/9/2026. Privacy contract. Measures public attention, not occupancy.
Human activity signals
Programming, social attention, temporal rhythm, and nearby pedestrian / cycling flow. An experimental aggregate layer that complements the spatial scores. Partial coverage, partial confidence.
Activity reading: no inputs available. The strongest signal is public attention / mentions. Source coverage: google-places.
Does this score feel accurate?
Your read of Maple Claire Park matters. We’re testing whether the model lines up with how people actually use the park. Submissions are stored locally; no account needed.
Tell us how this park feels
We measure structure (canopy, edges, connectivity). You measure feeling. Both matter, and disagreement is itself useful civic data.
What would improve this park?
Generated from the weakest measured dimensions: a starting point, not a prescription.
- Diversify what people can do in the park (playground, washroom, water, shade, performance, sport, garden): even small additions raise this score.
Data sources
- City of Toronto Open Data: Parks (Green Space)Polygon boundaries, official names, types. Boundaries are reconciled against OpenStreetMap (ODbL) for new and updated parks.
- Parks & Recreation FacilitiesInventory of in-park amenities (washrooms, fields, rinks…).
- Toronto Pedestrian NetworkSidewalk segments around and through parks; estimated park entrances.
- Toronto Centreline V2Street segments + intersection nodes near park edges; trails and walkways.
- Toronto 3D MassingBuilding footprints + heights for edge-building counts, frontage density, and tower-in-the-park risk.
- Toronto Treed AreaTree canopy share inside park polygons via stratified-grid sampling.
- Toronto Waterbodies & RiversWater surface inside parks + nearest-water distance for cooling.
- Ravine & Natural Feature ProtectionRavine overlap as a cooling / natural-comfort signal.
- Toronto Street Tree InventoryTree count + density inside park polygons.
- Neighbourhood Profiles(Pending) Equity context proxy.
- OpenStreetMap (Overpass API)Cafés, restaurants, retail, transit stops, parking, highways, rail.