WATERFRONT NEIGHBOURHOOD CENTRE - Building Grounds
Waterfront Park, in the top tier overall (score 49, rank ~94th percentile). Strongest: edge activation; weakest: amenity diversity.
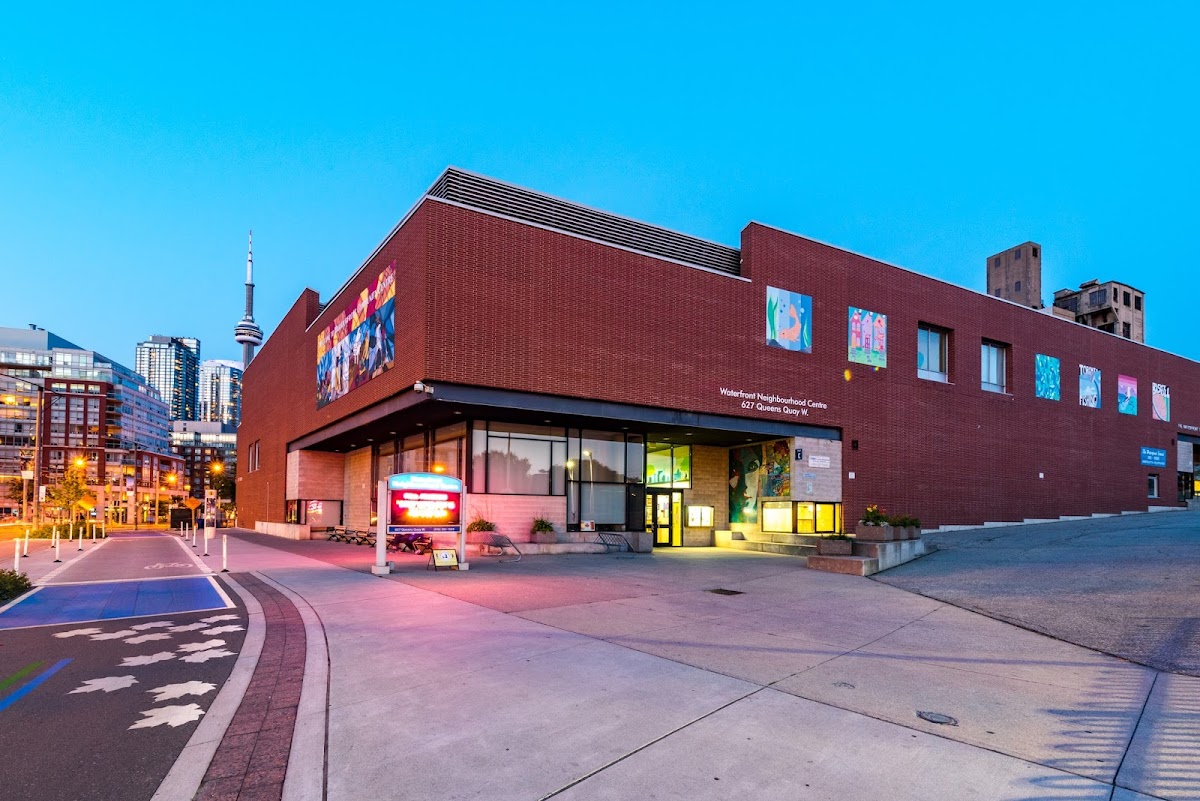
Photo by Waterfront Neighbourhood Centre via Google Places · cached 5/9/2026
WATERFRONT NEIGHBOURHOOD CENTRE - Building Grounds scores 49 / 100. Strongest dimensions: enclosure / eyes on park and connectivity. Weakest: amenity diversity (0). Border-vacuum risk is low. This score is a transparent reading of Jane Jacobs-style vitality factors, not a definitive judgment.
Area · 1.17 ha
Weighted across six dimensions · confidence 59%
Scores are not bell-curved. Percentiles and expected scores provide context without changing the underlying model.
Loading map…
The parks map is loading.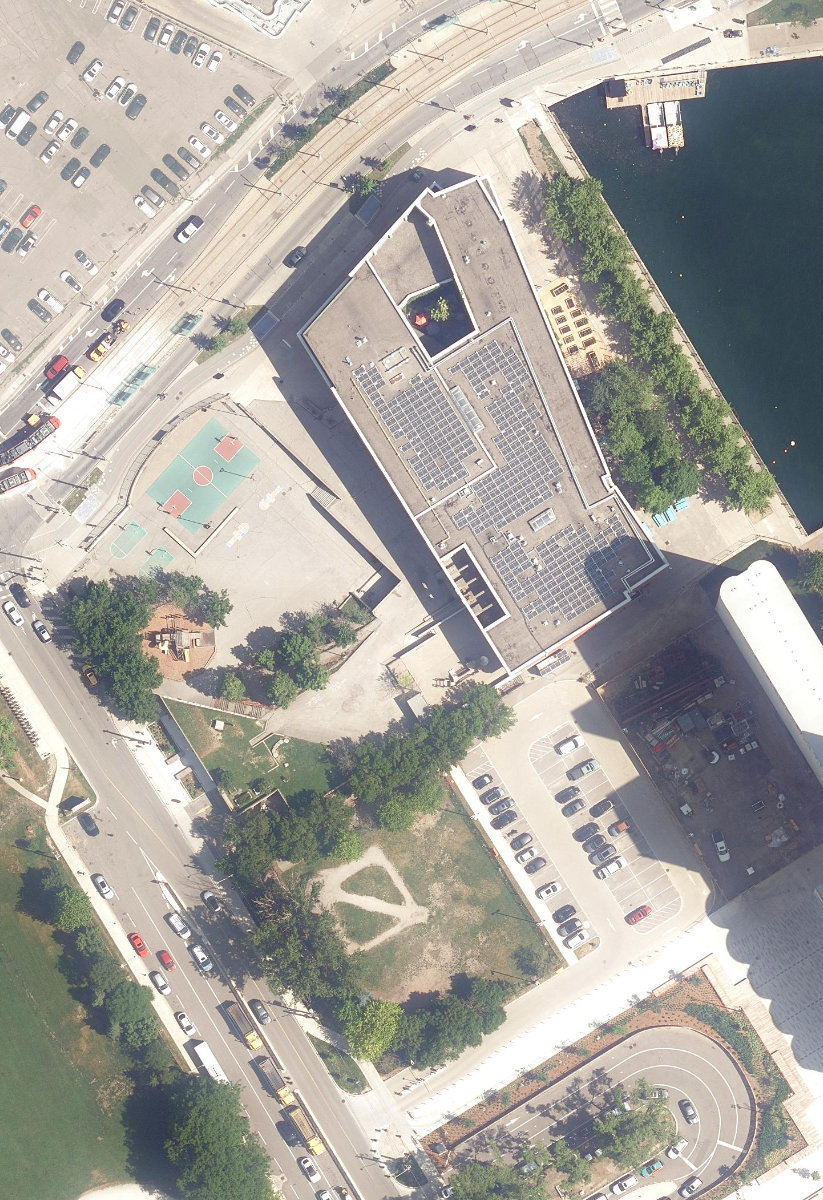
Explain this score
Where did the 49 come from? Each weighted contribution against a neutral 50 baseline. Green = pushed up; red = pulled down.
Sum of contributions = the headline score. A negative bar means that dimension dragged the park below the city-wide neutral baseline.
Why this park works
WATERFRONT NEIGHBOURHOOD CENTRE - Building Grounds works because its edge activation score (44) is in the top tier and its connectivity (64) is also top quartile.
What limits this park
WATERFRONT NEIGHBOURHOOD CENTRE - Building Grounds is held back by amenity diversity (0, below-average).
Most distinctive characteristic
Most distinctive feature: exceptionally high edge activation (44, top decile).
Jacobs reading
WATERFRONT NEIGHBOURHOOD CENTRE - Building Grounds sits between an urban social park and an ecological retreat: moderately useful for both, exceptionally suited to neither.
Performance in context
- This park is a strong overperformer for its cohort: raw 49 versus an expected 30 for similar parks (medium Waterfront Park waterfront) (gap +19).
Typology classification
Classified as Waterfront Park: name suggests waterfront and nearest waterbody is ~71 m away. Secondary read: Neighbourhood Park (1.2 ha, framed by 18 mid-rise vs 6 towers).
Edge Activation
Within 100 m of the park edge: 13 active uses (transit_stop, restaurant, retail, school, community) and 3 dead/hostile uses (parking_lot, highway). Active edges keep "eyes on the park" through the day; parking lots, blank institutional walls, rail and highway frontages drain street life.
Source: OSM POIs (amenity/shop) + Toronto Building Footprints + land use
Connectivity
Connectivity blends paths, intersections, transit, entrances, and edge density. This park has 10 mapped paths/walkways and 28 sidewalk segments within 50 m; 9 street intersections within 100 m; 10 transit stops within a 400 m walk; 1 estimated access points across ~508 m of perimeter. edge density is healthy, no superblock penalty. Source coverage: centreline, pedestrian_network, transit_osm.
Source: Toronto Centreline V2 + Pedestrian Network + OSM transit stops
Amenity Diversity
No amenities recorded. Score is 0 until inventory is loaded.
Source: Toronto Parks & Recreation Facilities + OSM amenity tags
Natural Comfort
Natural-comfort components for this park: ~15.5% effective canopy (0.0% from contiguous tree polygons + scattered tree density); nearest waterbody ~71 m; 26 city-mapped trees inside the polygon (22.1/ha). Reading: water-cooled. Source coverage: waterbodies, street_trees. Impervious surface is approximated (Toronto's authoritative layer ships only as a raster GeoTIFF).
Source: Toronto Treed Area + Ravine + Waterbodies + Street Tree Inventory
Enclosure / Eyes on Park
30 buildings within 25 m of the park edge (18 mid-rise, 6 low-rise, 6 tower); avg edge height 26.9 m (~9 floors); 5.9 buildings per 100 m of 508 m perimeter (strong frontage density); edges lean tall but still framed; 6 towers ≥ 40 m within 25 m of the edge. "Eyes on the park" come strongest from the 18 mid-rise edge buildings.
Source: Toronto 3D Massing (building footprints + heights)
Border Vacuum Risk
Park edges face the city. No significant border vacuum detected.
Source: Toronto Street Centreline (highways) + rail layer + OSM landuse + building footprints
Equity Context
Equity Context requires inputs not yet loaded for this park (Toronto Neighbourhood Profiles). Score is held at a neutral 50 with low confidence. Read with caution.
Source: Toronto Neighbourhood Profiles
Amenities (0)
No amenities recorded for this park.
Nearby active-edge features (38)
- school: City School0 m
- community: Waterfront Neighbourhood Centre0 m
- transit stop: Queens Quay West, Billy Bishop Airport12 m
- transit stop: Dan Leckie Way15 m
- restaurant: Maguro House37 m
- parking lot54 m
- retail: Harbour Green Farms56 m
- parking lot63 m
- restaurant: Iruka Sushi65 m
- transit stop: Billy Bishop Airport - Queens Quay65 m
- retail: Mike the Ticket Host66 m
- transit stop: Bathurst Street, Billy Bishop Airport73 m
- retail: Lincare Dry Cleaners Ltd.77 m
- restaurant: Blomboon Restaurant & Bar80 m
- transit stop: Dan Leckie Way85 m
- highway: Lake Shore Boulevard West92 m
- cafe: Aroma Espresso Bar100 m
- parking lot: Marina Parking104 m
- highway: Lake Shore Boulevard West106 m
- highway: Lake Shore Boulevard West107 m
- highway: Lake Shore Boulevard West109 m
- highway: Lake Shore Boulevard West110 m
- highway: Lake Shore Boulevard West113 m
- highway: Lake Shore Boulevard West120 m
- retail: Ride One126 m
- highway: Lake Shore Boulevard West134 m
- retail: T.O. Tuck Shop134 m
- highway: Lake Shore Boulevard West137 m
- parking lot147 m
- highway: Lake Shore Boulevard West152 m
- highway: Lake Shore Boulevard West166 m
- retail: Salon 500 Hair and Esthetics168 m
- retail: Loblaws173 m
- retail: Snatched TO176 m
- retail: Joe Fresh179 m
- transit stop: Fleet St at Bathurst St190 m
- parking lot: The Gravel Lot193 m
- highway: Lake Shore Boulevard West197 m
Park profile
Five-axis radar across the structural dimensions.
Citywide percentile ranks
Across all Toronto parks in the dataset.
- Overall vitality94th
- Edge activation94th
- Connectivity81th
- Amenity diversity33th
- Natural comfort62th
- Enclosure74th
Most similar parks
Closest in metric space across the five structural dimensions.
- Alexander Street ParketteUrban Plaza47
- Casimir Traffic IslandUrban Plaza46
- Kiwanis ParketteRavine / Naturalized Park49
- Toronto Hydro Green SpaceUrban Plaza49
- Charles Brereton ParkParkette48
Most opposite parks
Furthest in metric space. Useful for recognising what kind of park this isn’t.
- Toronto Islands - Muggs Island ParkRavine / Naturalized Park25
- Trca Lands ( 26)Ravine / Naturalized Park27
- Rouge ParkWaterfront Park25
- Rouge ParkRavine / Naturalized Park28
- Rouge ParkRavine / Naturalized Park21
Visitor signals
Public attention measured by Google Places aggregates. This proxies attention, not occupancy. Aggregate-only: no usernames, no review text, no extra photos beyond the cached hero.
p76 citywide · p76 within Waterfront Park
Source: Google Places API · match medium (0.76 composite confidence) · last refreshed 5/9/2026. Privacy contract. Measures public attention, not occupancy.
Human activity signals: not available
No activity signals have landed for this park yet. The model has scored its physical form but it can’t yet say how often it’s programmed, photographed, or walked through. See /data-ethics for what we will and will not collect.
Does this score feel accurate?
Your read of WATERFRONT NEIGHBOURHOOD CENTRE - Building Groundsmatters. We’re testing whether the model lines up with how people actually use the park. Submissions are stored locally; no account needed.
Tell us how this park feels
We measure structure (canopy, edges, connectivity). You measure feeling. Both matter, and disagreement is itself useful civic data.
What would improve this park?
Generated from the weakest measured dimensions: a starting point, not a prescription.
- Activate the edges: encourage cafés, retail or community uses on the streets that face the park; replace blank or parking-lot edges where possible.
- Diversify what people can do in the park (playground, washroom, water, shade, performance, sport, garden): even small additions raise this score.
Data sources
- City of Toronto Open Data: Parks (Green Space)Polygon boundaries, official names, types.
- Parks & Recreation FacilitiesInventory of in-park amenities (washrooms, fields, rinks…).
- Toronto Pedestrian NetworkSidewalk segments around and through parks; estimated park entrances.
- Toronto Centreline V2Street segments + intersection nodes near park edges; trails and walkways.
- Toronto 3D MassingBuilding footprints + heights for edge-building counts, frontage density, and tower-in-the-park risk.
- Toronto Treed AreaTree canopy share inside park polygons via stratified-grid sampling.
- Toronto Waterbodies & RiversWater surface inside parks + nearest-water distance for cooling.
- Ravine & Natural Feature ProtectionRavine overlap as a cooling / natural-comfort signal.
- Toronto Street Tree InventoryTree count + density inside park polygons.
- Neighbourhood Profiles(Pending) Equity context proxy.
- OpenStreetMap (Overpass API)Cafés, restaurants, retail, transit stops, parking, highways, rail.