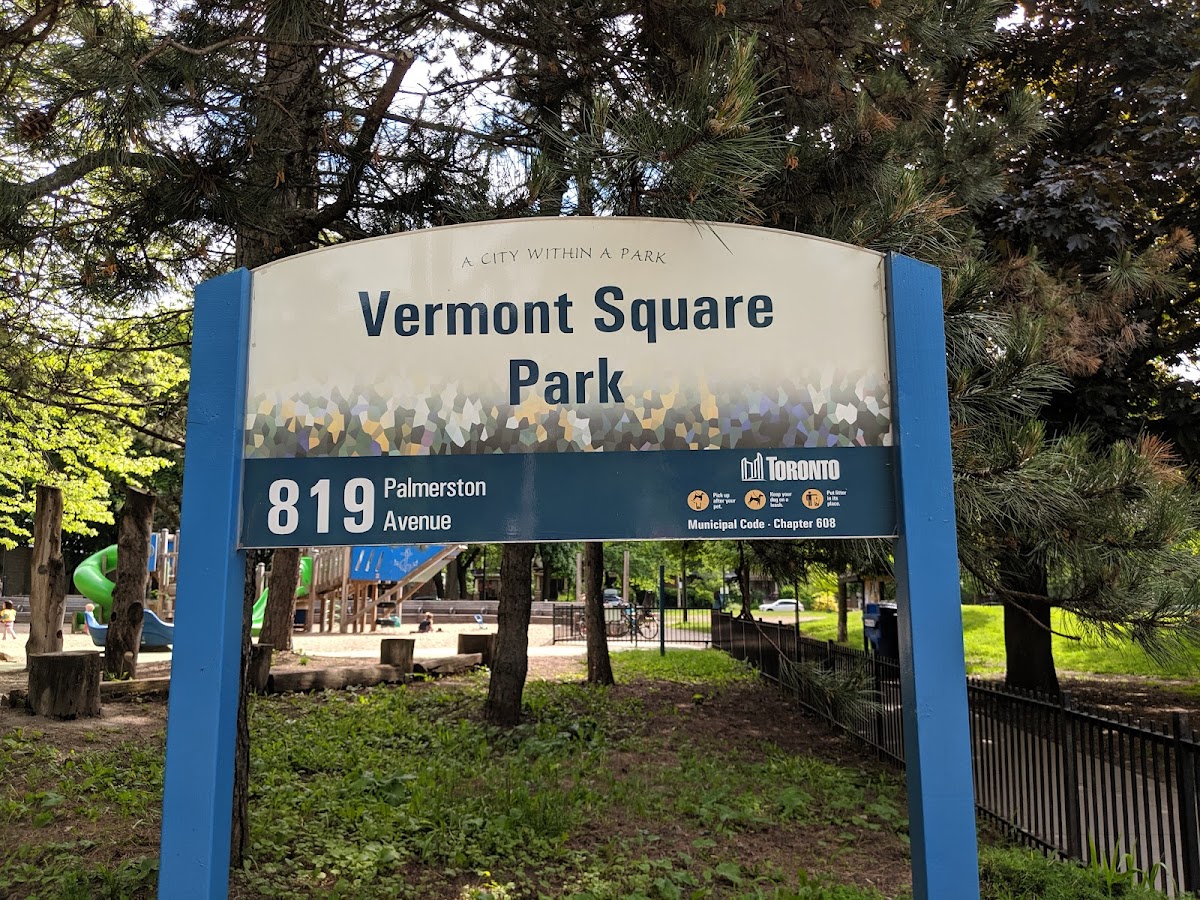
Vermont Square Park
Civic Square, one of the city's strongest overall (score 61, rank ~100th percentile). Strongest: amenity diversity; weakest: natural comfort.
Photo by Aldo Andrade via Google Places · cached 5/9/2026
Vermont Square Park scores 60.7 / 100. Strongest dimensions: enclosure / eyes on park and connectivity. Weakest: amenity diversity (39.8). Border-vacuum risk is low. This score is a transparent reading of Jane Jacobs-style vitality factors, not a definitive judgment.
Area · 1.53 ha
Weighted across six dimensions · confidence 72%
Scores are not bell-curved. Percentiles and expected scores provide context without changing the underlying model.
Loading map…
The parks map is loading.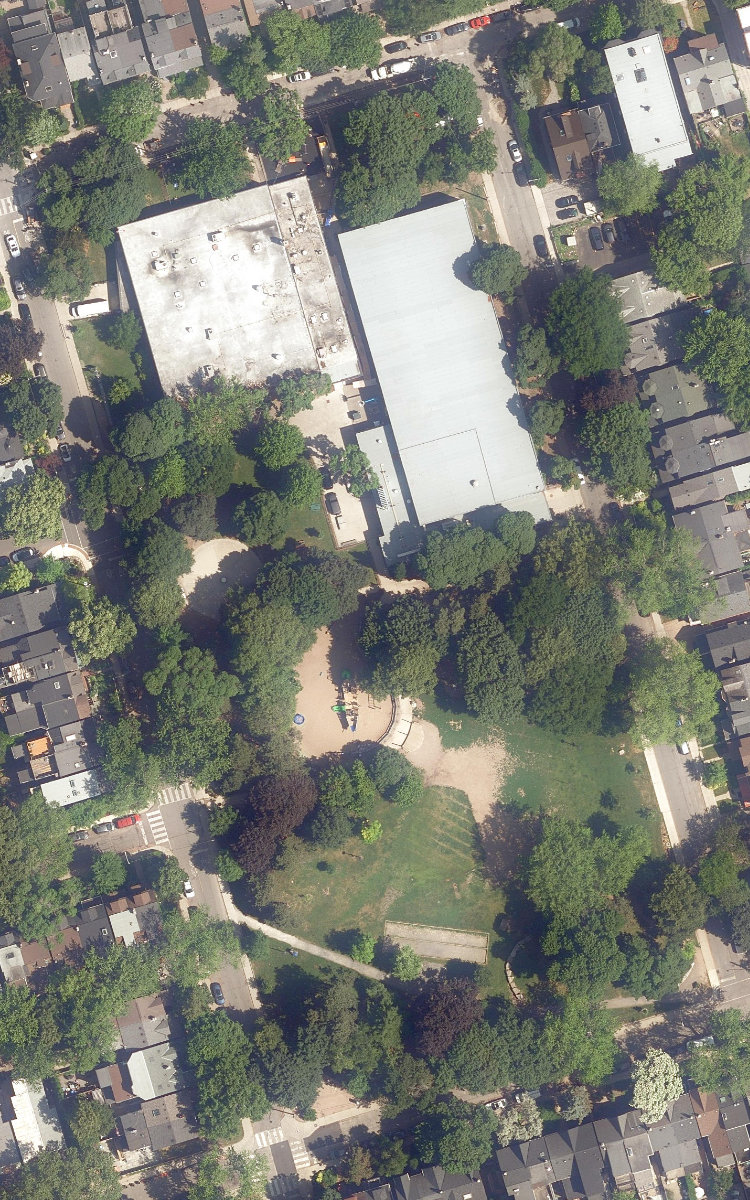
Explain this score
Where did the 61 come from? Each weighted contribution against a neutral 50 baseline. Green = pushed up; red = pulled down.
Sum of contributions = the headline score. A negative bar means that dimension dragged the park below the city-wide neutral baseline.
Why this park works
Vermont Square Park works because its amenity diversity score (40) is one of the city's strongest and its edge activation (49) is also top decile.
What limits this park
Vermont Square Park doesn't have a clear weakness. Every measured dimension is at or above the middle of the pack.
Most distinctive characteristic
Most distinctive feature: exceptionally high amenity diversity (40, top decile).
Jacobs reading
Vermont Square Park sits between an urban social park and an ecological retreat: moderately useful for both, exceptionally suited to neither.
Performance in context
- This park is a strong overperformer for its cohort: raw 61 versus an expected 39 for similar parks (medium Civic Square) (gap +21).
Typology classification
Classified as Civic Square: name flags as civic square + 150 buildings frame the edge. Secondary read: Neighbourhood Park (1.5 ha, framed by 34 mid-rise vs 0 towers).
Edge Activation
Within 100 m of the park edge: 11 active uses (cafe, retail, restaurant) and 2 dead/hostile uses (parking_lot). Active edges keep "eyes on the park" through the day; parking lots, blank institutional walls, rail and highway frontages drain street life.
Source: OSM POIs (amenity/shop) + Toronto Building Footprints + land use
Connectivity
Connectivity blends paths, intersections, transit, entrances, and edge density. This park has 8 mapped paths/walkways and 21 sidewalk segments within 50 m; 28 street intersections within 100 m; 14 transit stops within a 400 m walk; 8 estimated access points across ~540 m of perimeter. edge density is healthy, no superblock penalty. Source coverage: centreline, pedestrian_network, transit_osm.
Source: Toronto Centreline V2 + Pedestrian Network + OSM transit stops
Amenity Diversity
5 distinct amenity types in the park (community_centre, dog_area, picnic, playground, tennis). Diversity, not raw count, drives the score so a park with many distinct activity types can outrank a larger park that repeats the same use.
Source: Toronto Parks & Recreation Facilities + OSM amenity tags
Natural Comfort
Natural-comfort components for this park: ~21.1% effective canopy (3.7% from contiguous tree polygons + scattered tree density); nearest waterbody ~774 m; 46 city-mapped trees inside the polygon (30.1/ha). Reading: exposed. Source coverage: treed_area, waterbodies, street_trees. Impervious surface is approximated (Toronto's authoritative layer ships only as a raster GeoTIFF).
Source: Toronto Treed Area + Ravine + Waterbodies + Street Tree Inventory
Enclosure / Eyes on Park
150 buildings within 25 m of the park edge (34 mid-rise, 116 low-rise, 0 tower); avg edge height 8.0 m (~3 floors); 27.8 buildings per 100 m of 540 m perimeter (strong frontage density); edges are low-rise (mostly 2 to 3 floors); no towers immediately adjacent. "Eyes on the park" come strongest from the 34 mid-rise edge buildings.
Source: Toronto 3D Massing (building footprints + heights)
Border Vacuum Risk
Border-vacuum factors within 50 m of the park: parking_lot. Jacobs warned that highways, rail, parking lots and blank institutional edges act as "vacuums" that suppress foot traffic and isolate the park from its neighbourhood.
Source: Toronto Street Centreline (highways) + rail layer + OSM landuse + building footprints
Equity Context
Equity Context requires inputs not yet loaded for this park (Toronto Neighbourhood Profiles). Score is held at a neutral 50 with low confidence. Read with caution.
Source: Toronto Neighbourhood Profiles
Amenities (5 types · 5 records)
- community centre
- dog area
- picnic
- playground
- tennis
Nearby active-edge features (59)
- parking lot30 m
- parking lot81 m
- restaurant: KOS Cafe and Restaurant91 m
- retail: Alligator Party Rental96 m
- retail: Minerva Cannabis97 m
- restaurant: Gordo Ex97 m
- retail: Transmission Auto Repair97 m
- retail: Sonie's Creations97 m
- retail: Toutoune Gallery & Shop98 m
- retail: Micro Zoomiez98 m
- cafe: Chaveta Coffee98 m
- retail: Steven's Grocery98 m
- retail98 m
- retail: Mister Dupont101 m
- transit stop: Bathurst St at Wells St103 m
- retail: Story Planet103 m
- retail: F.G. Chong Dry Cleaners & Alterations112 m
- restaurant: El Pocho Antojitos Bar114 m
- retail: Studio 976 Hair Salon115 m
- retail: David Dunkley Fine Millinery118 m
- parking lot118 m
- transit stop: Palmerston Avenue122 m
- retail: Live Art Space123 m
- retail124 m
- restaurant: Grapefruit Moon126 m
- retail: Barbara Edwards Contemporary127 m
- transit stop: Bathurst St at Wells St127 m
- retail: Tattoo People128 m
- retail: Mrs. Huizenga130 m
- retail: Gussied Up130 m
- retail: Art Market132 m
- retail: The Showroom134 m
- retail: John's Shoe Repair141 m
- retail: Spring Nails & Spa142 m
- retail: Qalat144 m
- retail: BC-PC Technology Systems145 m
- restaurant: Napolitan Pizzeria146 m
- retail: Flur152 m
- retail: Bateman's Bicycle Company153 m
- retail: Steve's Custom Tailor & Cleaner153 m
- transit stop: Dupont St at Bathurst St155 m
- restaurant: Rapido156 m
- retail: La Parete Gallery159 m
- restaurant: Detroit Pizzeria163 m
- parking lot165 m
- transit stop: Bathurst Street at Dupont Street165 m
- retail: Catherine Curtis169 m
- restaurant: Miya Bhai173 m
- parking lot174 m
- restaurant: Domino's177 m
- transit stop: Bathurst Street at Dupont Street180 m
- retail: Auto Expert Auto Service184 m
- retail: OK Tire185 m
- transit stop: Dupont St at Bathurst St187 m
- parking lot187 m
- retail192 m
- restaurant: Vesta Lunch193 m
- cafe: Tim Hortons194 m
- transit stop: Manning Avenue196 m
Park profile
Five-axis radar across the structural dimensions.
Citywide percentile ranks
Across all Toronto parks in the dataset.
- Overall vitality100th
- Edge activation96th
- Connectivity95th
- Amenity diversity99th
- Natural comfort68th
- Enclosure92th
Most similar parks
Closest in metric space across the five structural dimensions.
- Dufferin Grove ParkAthletic / Recreation Park63
- Trace Manes ParkAthletic / Recreation Park55
- Bickford ParkRavine / Naturalized Park58
- Norwood ParkNeighbourhood Park59
- June Rowlands ParkNeighbourhood Park56
Most opposite parks
Furthest in metric space. Useful for recognising what kind of park this isn’t.
- Toronto Islands - Muggs Island ParkRavine / Naturalized Park25
- Rouge ParkRavine / Naturalized Park21
- Trca Lands ( 26)Ravine / Naturalized Park27
- Rouge ParkWaterfront Park25
- Rouge ParkRavine / Naturalized Park28
Visitor signals
Public attention measured by Google Places aggregates. This proxies attention, not occupancy. Aggregate-only: no usernames, no review text, no extra photos beyond the cached hero.
p85 citywide · p52 within Civic Square
Source: Google Places API · match unverified (0.00 composite confidence) · last refreshed 5/9/2026. Privacy contract. Measures public attention, not occupancy.
Human activity signals: not available
No activity signals have landed for this park yet. The model has scored its physical form but it can’t yet say how often it’s programmed, photographed, or walked through. See /data-ethics for what we will and will not collect.
Does this score feel accurate?
Your read of Vermont Square Parkmatters. We’re testing whether the model lines up with how people actually use the park. Submissions are stored locally; no account needed.
Tell us how this park feels
We measure structure (canopy, edges, connectivity). You measure feeling. Both matter, and disagreement is itself useful civic data.
What would improve this park?
Generated from the weakest measured dimensions: a starting point, not a prescription.
- Activate the edges: encourage cafés, retail or community uses on the streets that face the park; replace blank or parking-lot edges where possible.
- Diversify what people can do in the park (playground, washroom, water, shade, performance, sport, garden): even small additions raise this score.
Data sources
- City of Toronto Open Data: Parks (Green Space)Polygon boundaries, official names, types.
- Parks & Recreation FacilitiesInventory of in-park amenities (washrooms, fields, rinks…).
- Toronto Pedestrian NetworkSidewalk segments around and through parks; estimated park entrances.
- Toronto Centreline V2Street segments + intersection nodes near park edges; trails and walkways.
- Toronto 3D MassingBuilding footprints + heights for edge-building counts, frontage density, and tower-in-the-park risk.
- Toronto Treed AreaTree canopy share inside park polygons via stratified-grid sampling.
- Toronto Waterbodies & RiversWater surface inside parks + nearest-water distance for cooling.
- Ravine & Natural Feature ProtectionRavine overlap as a cooling / natural-comfort signal.
- Toronto Street Tree InventoryTree count + density inside park polygons.
- Neighbourhood Profiles(Pending) Equity context proxy.
- OpenStreetMap (Overpass API)Cafés, restaurants, retail, transit stops, parking, highways, rail.