June Rowlands Park
Neighbourhood Park, one of the city's strongest overall (score 56, rank ~99th percentile). Strongest: amenity diversity; weakest: natural comfort.
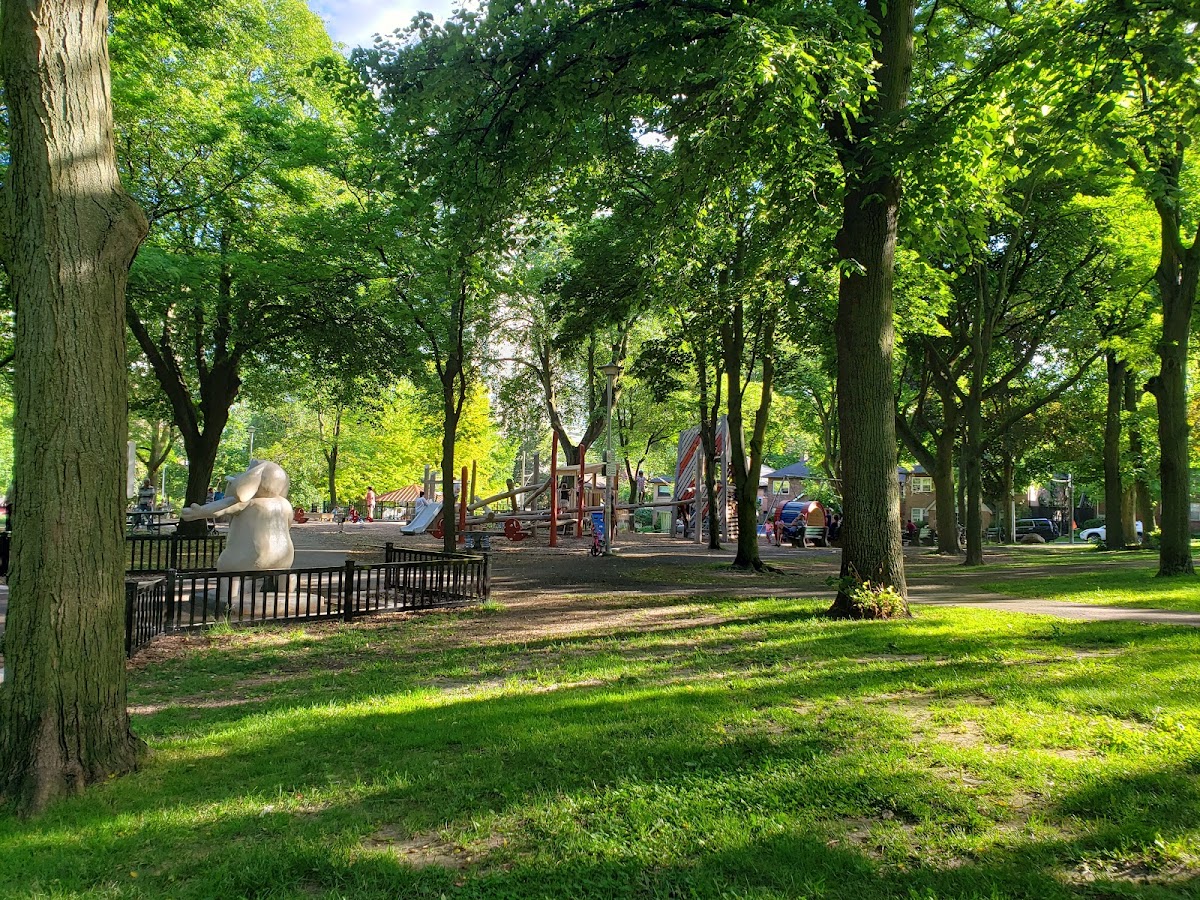
Photo by S K via Google Places · cached 5/9/2026
June Rowlands Park scores 56.1 / 100. Strongest dimensions: enclosure / eyes on park and connectivity. Weakest: edge activation (33.8). Border-vacuum risk is low. This score is a transparent reading of Jane Jacobs-style vitality factors, not a definitive judgment.
Area · 2.65 ha
Weighted across six dimensions · confidence 72%
Scores are not bell-curved. Percentiles and expected scores provide context without changing the underlying model.
Loading map…
The parks map is loading.
Explain this score
Where did the 56 come from? Each weighted contribution against a neutral 50 baseline. Green = pushed up; red = pulled down.
Sum of contributions = the headline score. A negative bar means that dimension dragged the park below the city-wide neutral baseline.
Why this park works
June Rowlands Park works because its amenity diversity score (40) is one of the city's strongest and its connectivity (73) is also top decile.
What limits this park
June Rowlands Park doesn't have a clear weakness. Every measured dimension is at or above the middle of the pack.
Most distinctive characteristic
Most distinctive feature: exceptionally high amenity diversity (40, top decile).
Jacobs reading
June Rowlands Park sits between an urban social park and an ecological retreat: moderately useful for both, exceptionally suited to neither.
Performance in context
- This park is a strong overperformer for its cohort: raw 56 versus an expected 37 for similar parks (medium Neighbourhood Park) (gap +19).
Typology classification
Classified as Neighbourhood Park: 2.7 ha, framed by 18 mid-rise vs 12 towers
Edge Activation
Within 100 m of the park edge: 27 active uses (transit_stop, retail, school, restaurant) and 6 dead/hostile uses (parking_lot). Active edges keep "eyes on the park" through the day; parking lots, blank institutional walls, rail and highway frontages drain street life.
Source: OSM POIs (amenity/shop) + Toronto Building Footprints + land use
Connectivity
Connectivity blends paths, intersections, transit, entrances, and edge density. This park has 10 mapped paths/walkways and 25 sidewalk segments within 50 m; 11 street intersections within 100 m; 17 transit stops within a 400 m walk; 9 estimated access points across ~658 m of perimeter. edge density is healthy, no superblock penalty. Source coverage: centreline, pedestrian_network, transit_osm.
Source: Toronto Centreline V2 + Pedestrian Network + OSM transit stops
Amenity Diversity
5 distinct amenity types in the park (picnic, playground, sports_field, tennis, washroom). Diversity, not raw count, drives the score so a park with many distinct activity types can outrank a larger park that repeats the same use.
Source: Toronto Parks & Recreation Facilities + OSM amenity tags
Natural Comfort
Natural-comfort components for this park: ~14.8% effective canopy (4.3% from contiguous tree polygons + scattered tree density); nearest waterbody ~954 m; 56 city-mapped trees inside the polygon (21.1/ha). Reading: exposed. Source coverage: treed_area, waterbodies, street_trees. Impervious surface is approximated (Toronto's authoritative layer ships only as a raster GeoTIFF).
Source: Toronto Treed Area + Ravine + Waterbodies + Street Tree Inventory
Enclosure / Eyes on Park
116 buildings within 25 m of the park edge (18 mid-rise, 86 low-rise, 12 tower); avg edge height 14.5 m (~5 floors); 17.6 buildings per 100 m of 658 m perimeter (strong frontage density); edges are at a Jacobs-scale walkable mid-rise (3 to 7 floors); 12 towers ≥ 40 m within 25 m of the edge. "Eyes on the park" come strongest from the 18 mid-rise edge buildings.
Source: Toronto 3D Massing (building footprints + heights)
Border Vacuum Risk
Border-vacuum factors within 50 m of the park: parking_lot. Jacobs warned that highways, rail, parking lots and blank institutional edges act as "vacuums" that suppress foot traffic and isolate the park from its neighbourhood.
Source: Toronto Street Centreline (highways) + rail layer + OSM landuse + building footprints
Equity Context
Equity Context requires inputs not yet loaded for this park (Toronto Neighbourhood Profiles). Score is held at a neutral 50 with low confidence. Read with caution.
Source: Toronto Neighbourhood Profiles
Amenities (5 types · 6 records)
- picnic
- playground
- sports field
- tennis
- washroom
Nearby active-edge features (63)
- transit stop: Mount Pleasant Road West Side1 m
- transit stop: Acacia Road1 m
- transit stop: Davisville Avenue1 m
- transit stop: Mount Pleasant Road16 m
- retail: Eye Studio23 m
- restaurant: Subway25 m
- transit stop: Acacia Road31 m
- restaurant: Starving Artist Waffles & Espresso31 m
- transit stop: Mount Pleasant Road32 m
- retail: Saati Fine Jewellery32 m
- restaurant: Millwood Bread & Butter33 m
- retail: Second Nature Boutique37 m
- retail: Mountain Convenience39 m
- transit stop: Davisville Avenue40 m
- parking lot44 m
- restaurant: Sushi Supreme45 m
- retail: Neptune Hairstyling48 m
- retail: Pampered Paws50 m
- retail: Ixxy Vape54 m
- restaurant: Krabi Thai Cuisine55 m
- parking lot57 m
- retail: Bob's Cleaners59 m
- parking lot60 m
- retail: E. Bapst Custom Upholstering63 m
- restaurant: Hazel's Diner68 m
- school: Toronto Prep School72 m
- parking lot73 m
- restaurant: Wild Chicory74 m
- retail: CCMH Toronto Student Intern Clinic74 m
- retail: Tech-Net Professional Auto Service77 m
- parking lot82 m
- parking lot92 m
- transit stop: Belsize Drive96 m
- parking lot111 m
- transit stop: Belsize Drive115 m
- retail: Mabel’s Fables120 m
- parking lot122 m
- restaurant: The Belsize Public House125 m
- retail: The Box Spot127 m
- parking lot141 m
- retail: Manderley Fine Furniture150 m
- restaurant: Marigold Indian Bistro151 m
- retail: Brentview Electronics156 m
- parking lot161 m
- parking lot164 m
- retail: Durant Sessions166 m
- restaurant: Instant Du Palais170 m
- retail: Elly Amar Studio171 m
- retail: Circle K175 m
- cafe: Tim Hortons175 m
- retail: Frame Master175 m
- retail: Livingstone & Co.175 m
- parking lot176 m
- parking lot178 m
- parking lot180 m
- parking lot182 m
- retail: Royal Antiques Rug Gallery188 m
- parking lot192 m
- parking lot192 m
- retail: Helene Clarkson193 m
- parking lot194 m
- parking lot198 m
- restaurant: OffCourt Bistro199 m
Park profile
Five-axis radar across the structural dimensions.
Citywide percentile ranks
Across all Toronto parks in the dataset.
- Overall vitality99th
- Edge activation89th
- Connectivity94th
- Amenity diversity99th
- Natural comfort61th
- Enclosure94th
Most similar parks
Closest in metric space across the five structural dimensions.
- Baird ParkParkette55
- Stanley Park North - TorontoAthletic / Recreation Park53
- Regent Park Athletic GroundsAthletic / Recreation Park52
- Fred Hamilton PlaygroundNeighbourhood Park56
- Lytton ParkRavine / Naturalized Park54
Most opposite parks
Furthest in metric space. Useful for recognising what kind of park this isn’t.
- Toronto Islands - Muggs Island ParkRavine / Naturalized Park25
- Trca Lands ( 26)Ravine / Naturalized Park27
- Rouge ParkRavine / Naturalized Park21
- Rouge ParkWaterfront Park25
- Rouge ParkRavine / Naturalized Park28
Visitor signals
Public attention measured by Google Places aggregates. This proxies attention, not occupancy. Aggregate-only: no usernames, no review text, no extra photos beyond the cached hero.
“Small neighborhood park with a baseball diamond, 6 tennis courts, a volleyball court & splash pad.” (Google editorial summary)
p93 citywide · p90 within Neighbourhood Park
Source: Google Places API · match unverified (0.00 composite confidence) · last refreshed 5/9/2026. Privacy contract. Measures public attention, not occupancy.
Human activity signals: not available
No activity signals have landed for this park yet. The model has scored its physical form but it can’t yet say how often it’s programmed, photographed, or walked through. See /data-ethics for what we will and will not collect.
Does this score feel accurate?
Your read of June Rowlands Parkmatters. We’re testing whether the model lines up with how people actually use the park. Submissions are stored locally; no account needed.
Tell us how this park feels
We measure structure (canopy, edges, connectivity). You measure feeling. Both matter, and disagreement is itself useful civic data.
What would improve this park?
Generated from the weakest measured dimensions: a starting point, not a prescription.
- Activate the edges: encourage cafés, retail or community uses on the streets that face the park; replace blank or parking-lot edges where possible.
- Diversify what people can do in the park (playground, washroom, water, shade, performance, sport, garden): even small additions raise this score.
Data sources
- City of Toronto Open Data: Parks (Green Space)Polygon boundaries, official names, types.
- Parks & Recreation FacilitiesInventory of in-park amenities (washrooms, fields, rinks…).
- Toronto Pedestrian NetworkSidewalk segments around and through parks; estimated park entrances.
- Toronto Centreline V2Street segments + intersection nodes near park edges; trails and walkways.
- Toronto 3D MassingBuilding footprints + heights for edge-building counts, frontage density, and tower-in-the-park risk.
- Toronto Treed AreaTree canopy share inside park polygons via stratified-grid sampling.
- Toronto Waterbodies & RiversWater surface inside parks + nearest-water distance for cooling.
- Ravine & Natural Feature ProtectionRavine overlap as a cooling / natural-comfort signal.
- Toronto Street Tree InventoryTree count + density inside park polygons.
- Neighbourhood Profiles(Pending) Equity context proxy.
- OpenStreetMap (Overpass API)Cafés, restaurants, retail, transit stops, parking, highways, rail.