Dufferin Grove Park
Athletic / Recreation Park, one of the city's strongest overall (score 63, rank ~100th percentile). Strongest: amenity diversity; weakest: natural comfort.
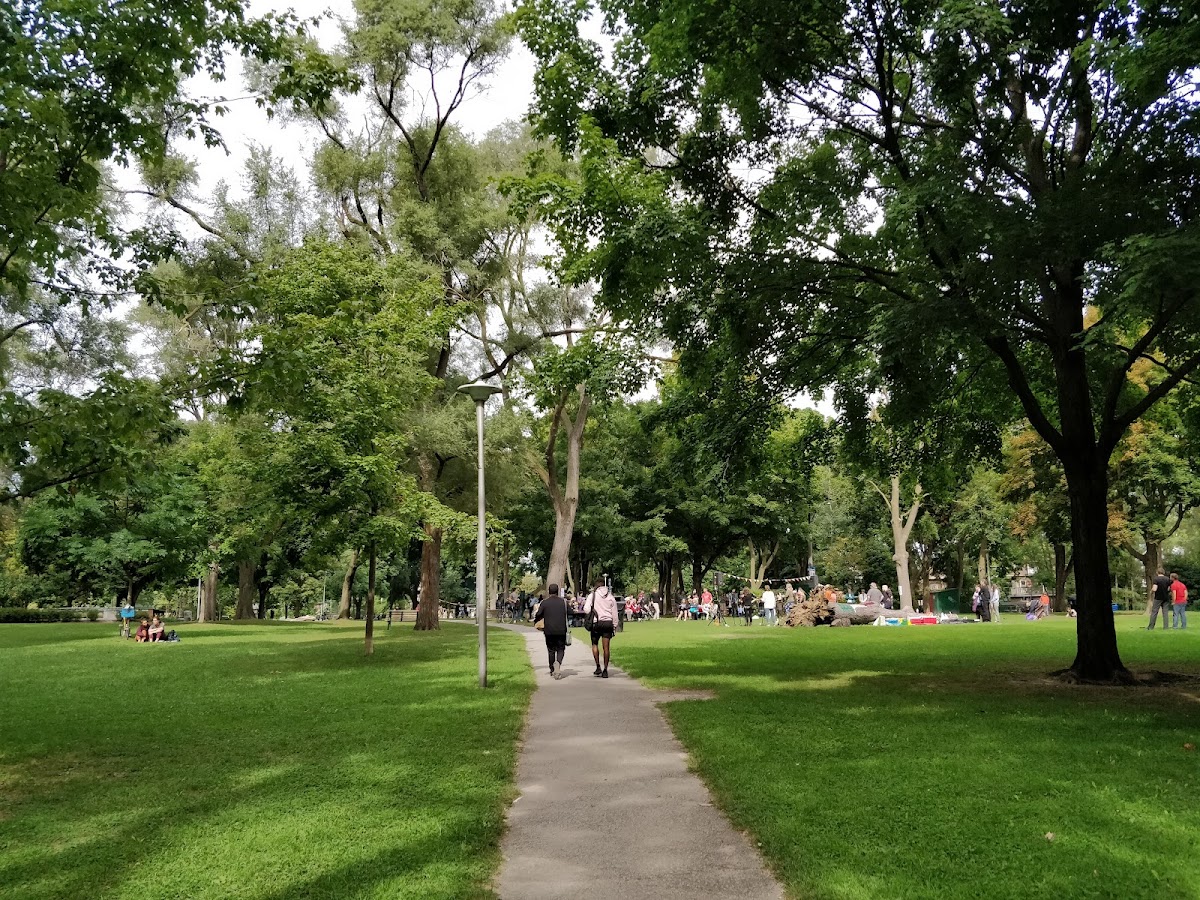
Photo by Enerio Rodriguez via Google Places · cached 5/9/2026
Dufferin Grove Park scores 63.4 / 100. Strongest dimensions: enclosure / eyes on park and connectivity. Weakest: amenity diversity (44.3). Border-vacuum risk is low. This score is a transparent reading of Jane Jacobs-style vitality factors, not a definitive judgment.
Area · 5.33 ha
Weighted across six dimensions · confidence 70%
Scores are not bell-curved. Percentiles and expected scores provide context without changing the underlying model.
Loading map…
The parks map is loading.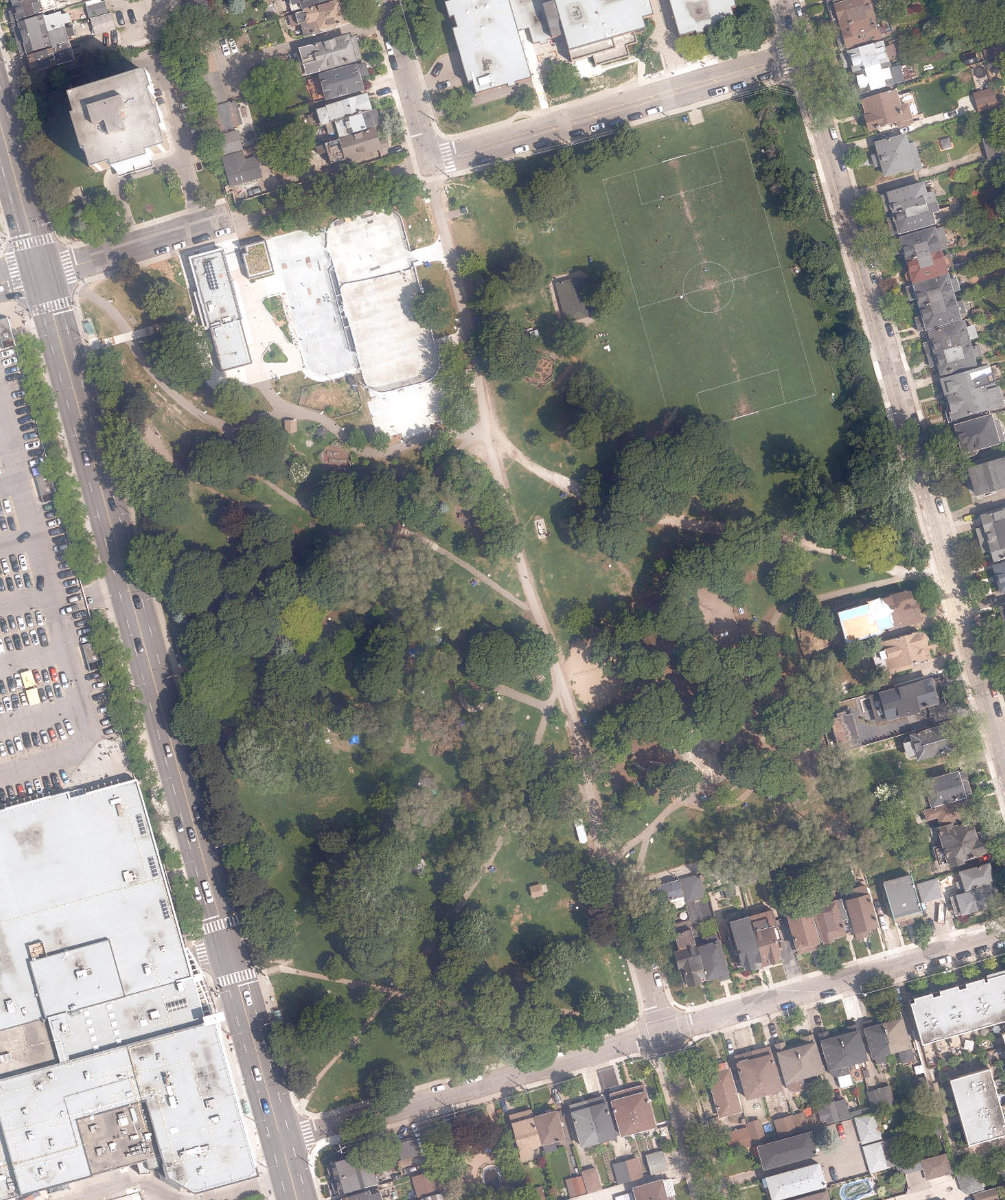
Explain this score
Where did the 63 come from? Each weighted contribution against a neutral 50 baseline. Green = pushed up; red = pulled down.
Sum of contributions = the headline score. A negative bar means that dimension dragged the park below the city-wide neutral baseline.
Why this park works
Dufferin Grove Park works because its amenity diversity score (44) is one of the city's strongest and its connectivity (82) is also top decile (6 distinct amenity types support different kinds of use).
What limits this park
Dufferin Grove Park doesn't have a clear weakness. Every measured dimension is at or above the middle of the pack.
Most distinctive characteristic
Most distinctive feature: exceptionally high amenity diversity (44, top decile).
Jacobs reading
Dufferin Grove Park is a balanced hybrid: strong urban integration (73) and meaningful natural comfort (63). Rare in the Toronto Park Catalogue.
Tradeoffs
- Connectivity (82) significantly outpaces natural comfort (52): well placed in the city but offers little shade or ecological respite.
Performance in context
- This park is a strong overperformer for its cohort: raw 63 versus an expected 42 for similar parks (Athletic / Recreation Park) (gap +22).
Typology classification
Classified as Athletic / Recreation Park: 50% of amenity types are athletic (basketball, skatepark, tennis). Secondary read: Neighbourhood Park (5.3 ha, framed by 34 mid-rise vs 1 towers).
Edge Activation
Within 100 m of the park edge: 20 active uses (retail, transit_stop, cafe) and 3 dead/hostile uses (parking_lot). Active edges keep "eyes on the park" through the day; parking lots, blank institutional walls, rail and highway frontages drain street life.
Source: OSM POIs (amenity/shop) + Toronto Building Footprints + land use
Connectivity
Connectivity blends paths, intersections, transit, entrances, and edge density. This park has 25 mapped paths/walkways and 50 sidewalk segments within 50 m; 19 street intersections within 100 m; 27 transit stops within a 400 m walk; 17 estimated access points across ~985 m of perimeter. edge density is healthy, no superblock penalty. Source coverage: centreline, pedestrian_network, transit_osm.
Source: Toronto Centreline V2 + Pedestrian Network + OSM transit stops
Amenity Diversity
6 distinct amenity types in the park (basketball, picnic, playground, skatepark, tennis, washroom). Diversity, not raw count, drives the score so a park with many distinct activity types can outrank a larger park that repeats the same use.
Source: Toronto Parks & Recreation Facilities + OSM amenity tags
Natural Comfort
Natural-comfort components for this park: ~16.8% effective canopy (10.9% from contiguous tree polygons + scattered tree density); 128 city-mapped trees inside the polygon (24.0/ha). Reading: exposed. Source coverage: treed_area, street_trees. Impervious surface is approximated (Toronto's authoritative layer ships only as a raster GeoTIFF).
Source: Toronto Treed Area + Ravine + Waterbodies + Street Tree Inventory
Enclosure / Eyes on Park
141 buildings within 25 m of the park edge (34 mid-rise, 106 low-rise, 1 tower); avg edge height 8.4 m (~3 floors); 14.3 buildings per 100 m of 985 m perimeter (strong frontage density); edges are low-rise (mostly 2 to 3 floors); 1 tower ≥ 40 m within 25 m of the edge. "Eyes on the park" come strongest from the 34 mid-rise edge buildings.
Source: Toronto 3D Massing (building footprints + heights)
Border Vacuum Risk
Border-vacuum factors within 50 m of the park: parking_lot. Jacobs warned that highways, rail, parking lots and blank institutional edges act as "vacuums" that suppress foot traffic and isolate the park from its neighbourhood.
Source: Toronto Street Centreline (highways) + rail layer + OSM landuse + building footprints
Equity Context
Equity Context requires inputs not yet loaded for this park (Toronto Neighbourhood Profiles). Score is held at a neutral 50 with low confidence. Read with caution.
Source: Toronto Neighbourhood Profiles
Amenities (6 types · 6 records)
- basketball
- picnic
- playground
- skatepark
- tennis
- washroom
Nearby active-edge features (80)
- transit stop: Dufferin St at Dufferin Park Ave2 m
- transit stop: Dufferin St at Sylvan Ave3 m
- transit stop: Sylvan Avenue17 m
- transit stop: Dufferin Mall22 m
- transit stop: Dufferin St at Dufferin Park Ave33 m
- retail: Marshalls37 m
- parking lot46 m
- retail: Urban Customz47 m
- parking lot: Dufferin Mall Parking (two levels)54 m
- cafe: Big Orange56 m
- retail: MobileCare73 m
- retail: Portage75 m
- retail: Dollarama77 m
- retail: Mark's77 m
- parking lot: Dufferin Mall Parking77 m
- retail: Express Yourself80 m
- retail: LinsonQ82 m
- retail: Hearing Solutions83 m
- retail: Mas Man84 m
- retail: Karen's Fine Jewellery87 m
- retail: Ardene91 m
- retail: INS Market92 m
- retail97 m
- cafe: Tim Hortons101 m
- retail: Eye on Optical108 m
- parking lot109 m
- retail: Champs114 m
- retail: Gap114 m
- restaurant: McDonald's114 m
- parking lot115 m
- restaurant: Mac's Sushi120 m
- transit stop: Croatia Street121 m
- restaurant: KFC123 m
- retail: Shefield Express128 m
- retail: Trade Secrets136 m
- retail: Batteries N' Gadgets139 m
- retail: Miniso140 m
- retail: Pandora147 m
- retail: April Sweets156 m
- retail: Kibo Market156 m
- restaurant: Pizza Pizza159 m
- restaurant: Villa Madina159 m
- restaurant: New York Fries159 m
- retail: Foot Locker160 m
- restaurant: Subway160 m
- retail: Aura Fragrances160 m
- retail: Pasito161 m
- retail: Journeys161 m
- retail: La Senza161 m
- retail: Call It Spring161 m
- retail: claire's161 m
- retail: Soft Moc161 m
- retail: Aldo161 m
- retail: Tommy Hilfiger161 m
- retail: Peoples Jewellers162 m
- retail: Stars162 m
- retail: Suzy Shier Le Chateau162 m
- retail: Best Buy Mobile163 m
- restaurant: Shanghai 360163 m
- retail: Telus165 m
- restaurant: Mr. Pretzels165 m
- restaurant: Cinnabon166 m
- retail: Michael Hill166 m
- retail: Swarovski166 m
- retail: Lids168 m
- retail: Fido168 m
- retail: The Soap Tree168 m
- restaurant: Thaï Express169 m
- retail: Freedom Mobile169 m
- retail: Goodtime Jewellers169 m
- parking lot169 m
- retail: Casefit169 m
- retail: WirelessWave169 m
- retail: Face Off169 m
- retail: The Brow Boutique169 m
- retail: Kalamata169 m
- retail: Tbooth Wireless169 m
- restaurant: Tanghulu Tanghulu170 m
- retail: Tbooth Wireless170 m
- retail: Virgin Plus170 m
Park profile
Five-axis radar across the structural dimensions.
Citywide percentile ranks
Across all Toronto parks in the dataset.
- Overall vitality100th
- Edge activation97th
- Connectivity99th
- Amenity diversity100th
- Natural comfort65th
- Enclosure88th
Most similar parks
Closest in metric space across the five structural dimensions.
- Vermont Square ParkCivic Square61
- Wells Hill ParkParkette61
- Trace Manes ParkAthletic / Recreation Park55
- Norwood ParkNeighbourhood Park59
- Alexandra ParkNeighbourhood Park55
Most opposite parks
Furthest in metric space. Useful for recognising what kind of park this isn’t.
- Toronto Islands - Muggs Island ParkRavine / Naturalized Park25
- Trca Lands ( 26)Ravine / Naturalized Park27
- Rouge ParkRavine / Naturalized Park21
- Rouge ParkWaterfront Park25
- Rouge ParkRavine / Naturalized Park26
Visitor signals
Public attention measured by Google Places aggregates. This proxies attention, not occupancy. Aggregate-only: no usernames, no review text, no extra photos beyond the cached hero.
“Large park with an ice rink & playground, plus basketball, picnic areas & a weekly farmer's market.” (Google editorial summary)
p96 citywide · p98 within Athletic / Recreation Park
Source: Google Places API · match unverified (0.00 composite confidence) · last refreshed 5/9/2026. Privacy contract. Measures public attention, not occupancy.
Human activity signals
Programming, social attention, temporal rhythm, and nearby pedestrian / cycling flow. An experimental aggregate layer that complements the spatial scores. Partial coverage, partial confidence.
Activity reading: 80 events/yr (40 recurring); 2,400 public mentions; pedestrian intensity 55/100; cycling/trail 50/100. The strongest signal is programmed civic use. These are illustrative sample values. Calibrate before citing.
Sample data: numbers shown here are an illustrative fixture for the 10 named parks, not a measurement.
Does this score feel accurate?
Your read of Dufferin Grove Parkmatters. We’re testing whether the model lines up with how people actually use the park. Submissions are stored locally; no account needed.
Tell us how this park feels
We measure structure (canopy, edges, connectivity). You measure feeling. Both matter, and disagreement is itself useful civic data.
What would improve this park?
Generated from the weakest measured dimensions: a starting point, not a prescription.
- Diversify what people can do in the park (playground, washroom, water, shade, performance, sport, garden): even small additions raise this score.
Data sources
- City of Toronto Open Data: Parks (Green Space)Polygon boundaries, official names, types.
- Parks & Recreation FacilitiesInventory of in-park amenities (washrooms, fields, rinks…).
- Toronto Pedestrian NetworkSidewalk segments around and through parks; estimated park entrances.
- Toronto Centreline V2Street segments + intersection nodes near park edges; trails and walkways.
- Toronto 3D MassingBuilding footprints + heights for edge-building counts, frontage density, and tower-in-the-park risk.
- Toronto Treed AreaTree canopy share inside park polygons via stratified-grid sampling.
- Toronto Waterbodies & RiversWater surface inside parks + nearest-water distance for cooling.
- Ravine & Natural Feature ProtectionRavine overlap as a cooling / natural-comfort signal.
- Toronto Street Tree InventoryTree count + density inside park polygons.
- Neighbourhood Profiles(Pending) Equity context proxy.
- OpenStreetMap (Overpass API)Cafés, restaurants, retail, transit stops, parking, highways, rail.