Flemingdon Park
Corridor / Linear Park, middle of the pack overall (score 35, rank ~56th percentile). Strongest: amenity diversity; weakest: edge activation.
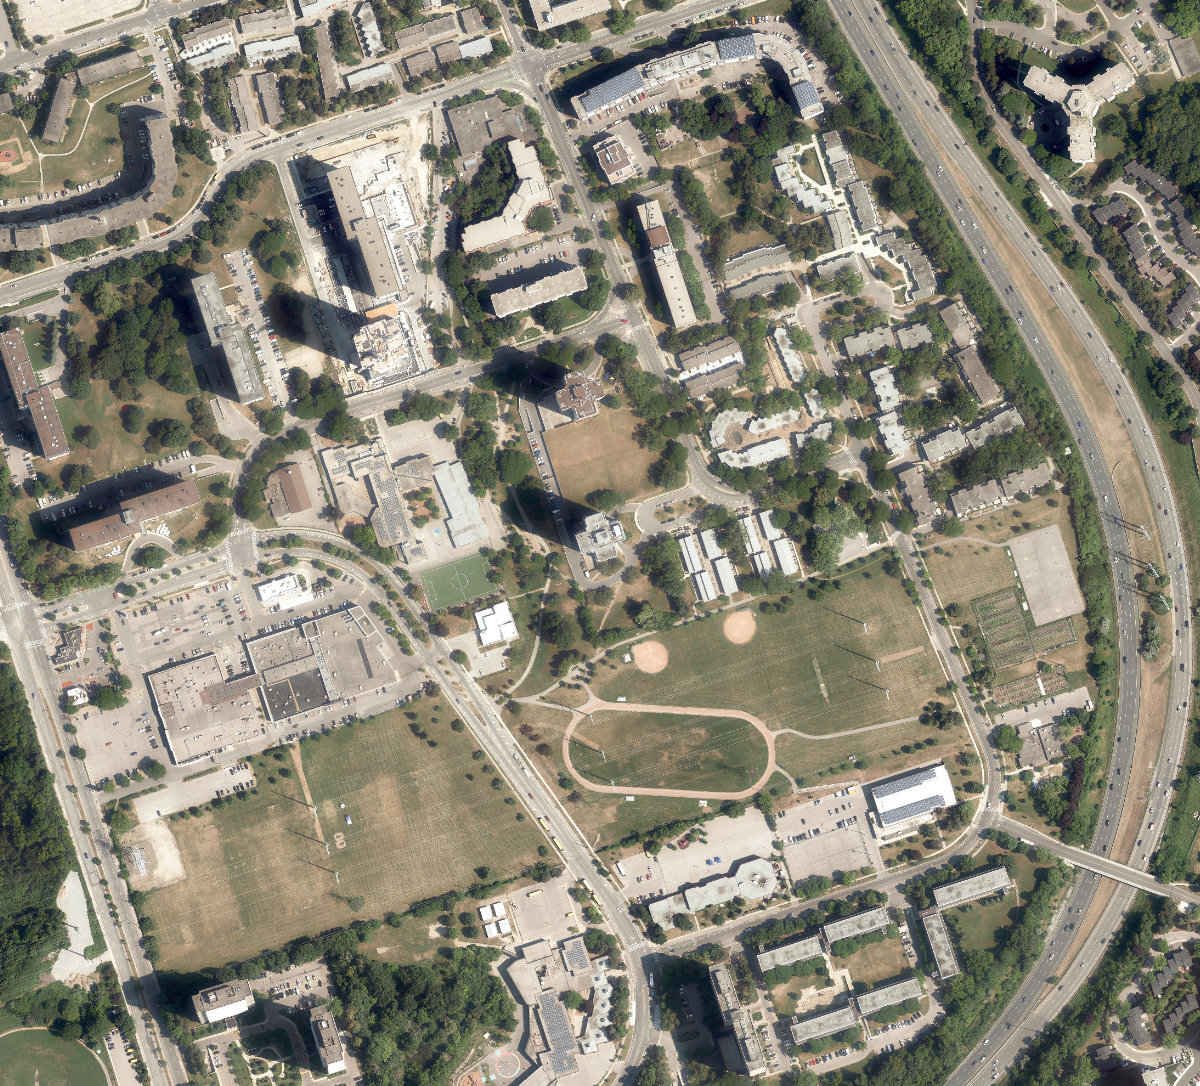
Aerial, City of Toronto orthophoto, ~8 cm/px source · cached 5/9/2026
Flemingdon Park scores 35.4 / 100. Strongest dimensions: connectivity and enclosure / eyes on park. Weakest: edge activation (0). Border-vacuum risk is elevated (100). This score is a transparent reading of Jane Jacobs-style vitality factors, not a definitive judgment.
Area · 14.25 ha
Weighted across six dimensions · confidence 68%
Scores are not bell-curved. Percentiles and expected scores provide context without changing the underlying model.
Loading map…
The parks map is loading.Explain this score
Where did the 35 come from? Each weighted contribution against a neutral 50 baseline. Green = pushed up; red = pulled down.
Sum of contributions = the headline score. A negative bar means that dimension dragged the park below the city-wide neutral baseline.
Why this park works
Flemingdon Park works because its amenity diversity score (40) is one of the city's strongest and its connectivity (77) is also top decile.
What limits this park
Flemingdon Park is held back by edge activation (0, bottom quartile): the surrounding streets carry too few active uses to spill into the park; border-vacuum risk is also elevated (100).
Most distinctive characteristic
Most distinctive feature: exceptionally high amenity diversity (40, top decile).
Jacobs reading
Flemingdon Park sits between an urban social park and an ecological retreat: moderately useful for both, exceptionally suited to neither.
Tradeoffs
- Connectivity (77) significantly outpaces natural comfort (39): well placed in the city but offers little shade or ecological respite.
- The park is enclosed by buildings (62) but the surrounding streets are quiet (edge activation 0): frame without animation.
- 13 nearby towers cast wind and shadow without contributing canopy: passive surveillance is plentiful but human-scale comfort is not.
- High connectivity coexists with high border-vacuum risk (100): much of that connectivity is to highways, rail, or parking lots, not to neighbourhoods.
Typology classification
Classified as Corridor / Linear Park: shape elongation 2.8× a circle of equal area. Secondary read: Athletic / Recreation Park (60% of amenity types are athletic (basketball, sports_field, track)).
Edge Activation
Within 100 m of the park edge: 30 active uses (restaurant, transit_stop, community, retail) and 22 dead/hostile uses (parking_lot, highway). Active edges keep "eyes on the park" through the day; parking lots, blank institutional walls, rail and highway frontages drain street life.
Source: OSM POIs (amenity/shop) + Toronto Building Footprints + land use
Connectivity
Connectivity blends paths, intersections, transit, entrances, and edge density. This park has 45 mapped paths/walkways and 57 sidewalk segments within 50 m; 24 street intersections within 100 m; 38 transit stops within a 400 m walk; 23 estimated access points across ~3,780 m of perimeter. low edge density, significant superblock penalty applied. Source coverage: centreline, pedestrian_network, transit_osm.
Source: Toronto Centreline V2 + Pedestrian Network + OSM transit stops
Amenity Diversity
5 distinct amenity types in the park (basketball, community_centre, playground, sports_field, track). Diversity, not raw count, drives the score so a park with many distinct activity types can outrank a larger park that repeats the same use.
Source: Toronto Parks & Recreation Facilities + OSM amenity tags
Natural Comfort
Natural-comfort components for this park: ~4.2% effective canopy (0.0% from contiguous tree polygons + scattered tree density); nearest waterbody ~598 m; 86 city-mapped trees inside the polygon (6.0/ha). Reading: exposed. Source coverage: waterbodies, street_trees. Impervious surface is approximated (Toronto's authoritative layer ships only as a raster GeoTIFF).
Source: Toronto Treed Area + Ravine + Waterbodies + Street Tree Inventory
Enclosure / Eyes on Park
83 buildings within 25 m of the park edge (16 mid-rise, 54 low-rise, 13 tower); avg edge height 17.6 m (~6 floors); 2.2 buildings per 100 m of 3,780 m perimeter (moderate frontage density); edges are at a Jacobs-scale walkable mid-rise (3 to 7 floors); 13 towers ≥ 40 m within 25 m of the edge. "Eyes on the park" come strongest from the 16 mid-rise edge buildings.
Source: Toronto 3D Massing (building footprints + heights)
Border Vacuum Risk
Border-vacuum factors within 50 m of the park: parking_lot, parking_lot, parking_lot, parking_lot, parking_lot, parking_lot, parking_lot, parking_lot, parking_lot, parking_lot, parking_lot, parking_lot. Jacobs warned that highways, rail, parking lots and blank institutional edges act as "vacuums" that suppress foot traffic and isolate the park from its neighbourhood.
Source: Toronto Street Centreline (highways) + rail layer + OSM landuse + building footprints
Equity Context
Equity Context requires inputs not yet loaded for this park (Toronto Neighbourhood Profiles). Score is held at a neutral 50 with low confidence. Read with caution.
Source: Toronto Neighbourhood Profiles
Amenities (5 types · 7 records)
- basketball
- community centre
- playground
- sports field
- track
Nearby active-edge features (80)
- community: Dennis R Timbrell Resource Centre0 m
- community: Toronto Public Library - Flemingdon Park0 m
- parking lot0 m
- parking lot0 m
- retail: Flemingdon Community Farm0 m
- parking lot0 m
- transit stop: Deauville Lane1 m
- transit stop6 m
- transit stop6 m
- transit stop7 m
- parking lot12 m
- parking lot13 m
- transit stop16 m
- transit stop16 m
- transit stop: Grenoble Drive East Side19 m
- transit stop: Spanbridge Rd at Grenoble Dr20 m
- transit stop: St Dennis Drive21 m
- transit stop: Spanbridge Road23 m
- parking lot24 m
- parking lot26 m
- parking lot27 m
- parking lot28 m
- parking lot29 m
- parking lot43 m
- parking lot44 m
- parking lot51 m
- highway: Don Valley Parkway54 m
- parking lot54 m
- highway: Don Valley Parkway55 m
- restaurant: Mulan Chinese Cuisine63 m
- transit stop: 25 St Dennis Dr67 m
- parking lot68 m
- retail: Razzaks Computers Electronics71 m
- parking lot73 m
- retail: Sunny Foodmart76 m
- parking lot79 m
- retail: Razzaks Computers Electronics80 m
- retail: Pioneer Delicatessen80 m
- restaurant: Pho Thien Phat80 m
- restaurant: Osaka Sushi80 m
- restaurant: Kabul-Tehran Restaurant81 m
- retail: Bollywood DVD81 m
- retail: Gerry's81 m
- retail: Scrubby's82 m
- retail: icell wireless82 m
- restaurant: Mr. Sub82 m
- retail: Cash Now82 m
- parking lot84 m
- transit stop: Opposite 25 St Dennis Dr84 m
- transit stop: Flemingdon Park Shopping Centre88 m
- parking lot94 m
- parking lot98 m
- parking lot102 m
- transit stop108 m
- transit stop: 32 Saint Dennis Drive109 m
- transit stop: Spanbridge Rd at Vicora Linkway111 m
- transit stop117 m
- restaurant: Subway118 m
- parking lot119 m
- transit stop120 m
- parking lot122 m
- transit stop: Windy Golfway (South)123 m
- parking lot123 m
- restaurant: Pita Land125 m
- transit stop: Gateway Boulevard128 m
- transit stop: Grenoble Drive130 m
- parking lot131 m
- parking lot132 m
- retail: Kitchen Food Fair132 m
- parking lot135 m
- transit stop: Windy Golfway (South)136 m
- parking lot136 m
- parking lot137 m
- parking lot139 m
- transit stop: Don Mills Road/Gateway Boulevard140 m
- transit stop: Grenoble Drive (North)140 m
- parking lot144 m
- parking lot163 m
- transit stop: Grenoble Drive (North)165 m
- parking lot174 m
Park profile
Five-axis radar across the structural dimensions.
Citywide percentile ranks
Across all Toronto parks in the dataset.
- Overall vitality56th
- Edge activation21th
- Connectivity97th
- Amenity diversity98th
- Natural comfort34th
- Enclosure46th
Most similar parks
Closest in metric space across the five structural dimensions.
- Gihon Spring ParkAthletic / Recreation Park44
- Colonel Samuel Smith ParkWaterfront Park34
- Hendon ParkAthletic / Recreation Park41
- Queensway ParkCorridor / Linear Park43
- Neilson Park - ScarboroughOther41
Most opposite parks
Furthest in metric space. Useful for recognising what kind of park this isn’t.
- Trca Lands ( 26)Ravine / Naturalized Park27
- Simcoe ParkTower-Community Green Space51
- Toronto Islands - Muggs Island ParkRavine / Naturalized Park25
- Manor Community GreenUrban Plaza57
- Market Lane ParkUrban Plaza63
Human activity signals: not available
No activity signals have landed for this park yet. The model has scored its physical form but it can’t yet say how often it’s programmed, photographed, or walked through. See /data-ethics for what we will and will not collect.
Does this score feel accurate?
Your read of Flemingdon Parkmatters. We’re testing whether the model lines up with how people actually use the park. Submissions are stored locally; no account needed.
Tell us how this park feels
We measure structure (canopy, edges, connectivity). You measure feeling. Both matter, and disagreement is itself useful civic data.
What would improve this park?
Generated from the weakest measured dimensions: a starting point, not a prescription.
- Activate the edges: encourage cafés, retail or community uses on the streets that face the park; replace blank or parking-lot edges where possible.
- Diversify what people can do in the park (playground, washroom, water, shade, performance, sport, garden): even small additions raise this score.
- Increase canopy and reduce paved area. Shade and water features extend usable hours and seasons.
- Mitigate border vacuums (highways, rail, parking) with active programming on the still-permeable edges and treat the hostile edge as a design challenge.
Data sources
- City of Toronto Open Data: Parks (Green Space)Polygon boundaries, official names, types.
- Parks & Recreation FacilitiesInventory of in-park amenities (washrooms, fields, rinks…).
- Toronto Pedestrian NetworkSidewalk segments around and through parks; estimated park entrances.
- Toronto Centreline V2Street segments + intersection nodes near park edges; trails and walkways.
- Toronto 3D MassingBuilding footprints + heights for edge-building counts, frontage density, and tower-in-the-park risk.
- Toronto Treed AreaTree canopy share inside park polygons via stratified-grid sampling.
- Toronto Waterbodies & RiversWater surface inside parks + nearest-water distance for cooling.
- Ravine & Natural Feature ProtectionRavine overlap as a cooling / natural-comfort signal.
- Toronto Street Tree InventoryTree count + density inside park polygons.
- Neighbourhood Profiles(Pending) Equity context proxy.
- OpenStreetMap (Overpass API)Cafés, restaurants, retail, transit stops, parking, highways, rail.