Trca Lands ( 32)
Waterfront Park, middle of the pack overall (score 30, rank ~31th percentile). Strongest: edge activation; weakest: enclosure.
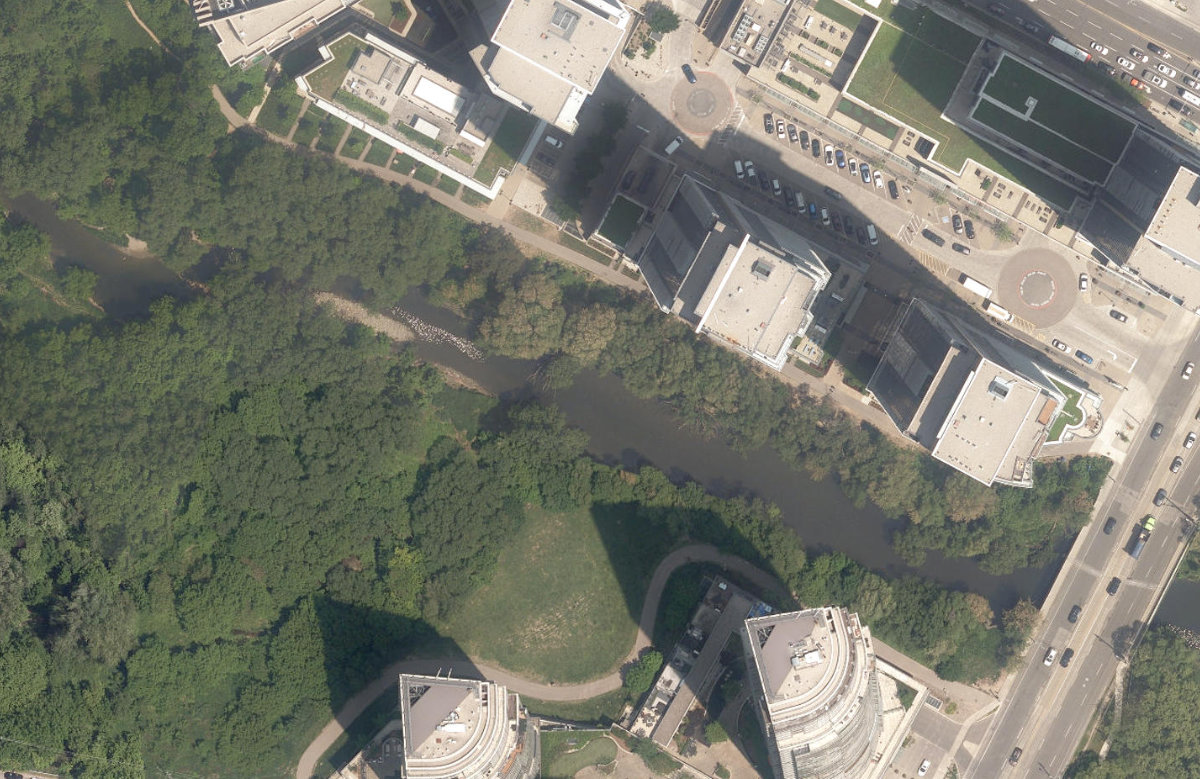
Aerial, City of Toronto orthophoto, ~8 cm/px source · cached 5/9/2026
Trca Lands ( 32) scores 30 / 100. Strongest dimensions: natural comfort and enclosure / eyes on park. Weakest: amenity diversity (0). Border-vacuum risk is elevated (100). This score is a transparent reading of Jane Jacobs-style vitality factors, not a definitive judgment.
Area · 1.03 ha
Weighted across six dimensions · confidence 63%
Scores are not bell-curved. Percentiles and expected scores provide context without changing the underlying model.
Loading map…
The parks map is loading.Explain this score
Where did the 30 come from? Each weighted contribution against a neutral 50 baseline. Green = pushed up; red = pulled down.
Sum of contributions = the headline score. A negative bar means that dimension dragged the park below the city-wide neutral baseline.
Why this park works
Trca Lands ( 32) works because its edge activation score (29) is in the top tier and its natural comfort (60) is also top quartile.
What limits this park
Trca Lands ( 32) is held back by enclosure (47, bottom quartile); border-vacuum risk is also elevated (100).
Most distinctive characteristic
Most distinctive feature: exceptionally low enclosure (47, bottom quartile).
Jacobs reading
Trca Lands ( 32) sits between an urban social park and an ecological retreat: moderately useful for both, exceptionally suited to neither.
Typology classification
Classified as Waterfront Park: 23% water surface inside park. Secondary read: Ravine / Naturalized Park (99% ravine overlap, 7% canopy).
Edge Activation
Within 100 m of the park edge: 20 active uses (transit_stop, restaurant, retail, cafe) and 6 dead/hostile uses (highway, parking_lot). Active edges keep "eyes on the park" through the day; parking lots, blank institutional walls, rail and highway frontages drain street life.
Source: OSM POIs (amenity/shop) + Toronto Building Footprints + land use
Connectivity
Connectivity blends paths, intersections, transit, entrances, and edge density. This park has 2 mapped paths/walkways and 2 sidewalk segments within 50 m; 7 street intersections within 100 m; 14 transit stops within a 400 m walk; 2 estimated access points across ~673 m of perimeter. moderate edge density, small superblock penalty applied. Source coverage: centreline, pedestrian_network, transit_osm.
Source: Toronto Centreline V2 + Pedestrian Network + OSM transit stops
Amenity Diversity
No amenities recorded. Score is 0 until inventory is loaded.
Source: Toronto Parks & Recreation Facilities + OSM amenity tags
Natural Comfort
Natural-comfort components for this park: ~9.5% effective canopy (7.0% from contiguous tree polygons + scattered tree density); 98.6% inside the ravine system; 22.5% water surface; 14 city-mapped trees inside the polygon (13.6/ha). Reading: ravine-cooled. Source coverage: treed_area, ravine, waterbodies, street_trees. Impervious surface is approximated (Toronto's authoritative layer ships only as a raster GeoTIFF).
Source: Toronto Treed Area + Ravine + Waterbodies + Street Tree Inventory
Enclosure / Eyes on Park
25 buildings within 25 m of the park edge (7 mid-rise, 4 low-rise, 14 tower); avg edge height 71.5 m (~24 floors); 3.7 buildings per 100 m of 673 m perimeter (strong frontage density); edges dominated by towers; 14 towers ≥ 40 m within 25 m of the edge. "Eyes on the park" come strongest from the 7 mid-rise edge buildings.
Source: Toronto 3D Massing (building footprints + heights)
Border Vacuum Risk
Border-vacuum factors within 50 m of the park: Lake Shore Boulevard West, Lake Shore Boulevard West, Lake Shore Boulevard West, parking_lot. Jacobs warned that highways, rail, parking lots and blank institutional edges act as "vacuums" that suppress foot traffic and isolate the park from its neighbourhood.
Source: Toronto Street Centreline (highways) + rail layer + OSM landuse + building footprints
Equity Context
Equity Context requires inputs not yet loaded for this park (Toronto Neighbourhood Profiles). Score is held at a neutral 50 with low confidence. Read with caution.
Source: Toronto Neighbourhood Profiles
Amenities (0)
No amenities recorded for this park.
Nearby active-edge features (50)
- transit stop10 m
- highway: Lake Shore Boulevard West20 m
- highway: Lake Shore Boulevard West20 m
- retail: LCBO22 m
- retail: The Bone & Biscuit Co.24 m
- retail: Platis Cleaners25 m
- restaurant: Panago25 m
- parking lot25 m
- restaurant: Sunset Grill27 m
- restaurant: Freshii33 m
- highway: Lake Shore Boulevard West35 m
- retail: Massage Addict38 m
- retail: Top Modern Nail Spa49 m
- transit stop: Park Lawn Road51 m
- highway: Lake Shore Boulevard West62 m
- parking lot65 m
- cafe: Starbucks70 m
- retail: Metro71 m
- retail: Hasty Market75 m
- transit stop: Park Lawn Road78 m
- transit stop: Park Lawn Rd at Lake Shore Blvd W83 m
- restaurant: Fresh Pizza Plus86 m
- retail: Park Lawn Cleaners90 m
- transit stop: Marine Parade Dr Loop at Lake Shore Blvd W91 m
- retail: En Vogue Hair Salon & Spa97 m
- retail: Mimico Nails Bar97 m
- parking lot108 m
- transit stop: Legion Road111 m
- transit stop: Park Lawn Rd at Lake Shore Blvd W112 m
- cafe: Avenue Cafe + Bistro118 m
- parking lot126 m
- transit stop: Legion Road132 m
- transit stop135 m
- parking lot135 m
- highway: Lake Shore Boulevard West152 m
- parking lot160 m
- transit stop: Legion Road160 m
- parking lot163 m
- highway: Lake Shore Boulevard West170 m
- rail: Oakville Subdivision173 m
- rail: Oakville Subdivision177 m
- rail: Oakville Subdivision181 m
- transit stop182 m
- rail: Oakville Subdivision185 m
- rail: Oakville Subdivision187 m
- cafe: Holo Tea & Cafe187 m
- rail: Oakville Subdivision191 m
- parking lot194 m
- rail: Oakville Subdivision195 m
- rail: Oakville Subdivision198 m
Park profile
Five-axis radar across the structural dimensions.
Citywide percentile ranks
Across all Toronto parks in the dataset.
- Overall vitality31th
- Edge activation86th
- Connectivity45th
- Amenity diversity31th
- Natural comfort75th
- Enclosure11th
Most similar parks
Closest in metric space across the five structural dimensions.
- Downsview ParkRavine / Naturalized Park41
- Runneymede LandsNeighbourhood Park36
- Enfield ParkRavine / Naturalized Park40
- Donalda ClubWaterfront Park43
- Rouge ParkCorridor / Linear Park40
Most opposite parks
Furthest in metric space. Useful for recognising what kind of park this isn’t.
- Leslie Grove ParkParkette68
- ALEX WILSON COMMUNITY GARDEN - Open Green SpaceUrban Plaza59
- Ramsden ParkRavine / Naturalized Park43
- High ParkRavine / Naturalized Park47
- Withrow ParkNeighbourhood Park50
Human activity signals: not available
No activity signals have landed for this park yet. The model has scored its physical form but it can’t yet say how often it’s programmed, photographed, or walked through. See /data-ethics for what we will and will not collect.
Does this score feel accurate?
Your read of Trca Lands ( 32)matters. We’re testing whether the model lines up with how people actually use the park. Submissions are stored locally; no account needed.
Tell us how this park feels
We measure structure (canopy, edges, connectivity). You measure feeling. Both matter, and disagreement is itself useful civic data.
What would improve this park?
Generated from the weakest measured dimensions: a starting point, not a prescription.
- Activate the edges: encourage cafés, retail or community uses on the streets that face the park; replace blank or parking-lot edges where possible.
- Add or open more entrances and improve sidewalk continuity around the park. More permeability means more spontaneous use.
- Diversify what people can do in the park (playground, washroom, water, shade, performance, sport, garden): even small additions raise this score.
- Encourage mid-rise, windowed frontages around the park so residents have direct sightlines onto it.
- Mitigate border vacuums (highways, rail, parking) with active programming on the still-permeable edges and treat the hostile edge as a design challenge.
Data sources
- City of Toronto Open Data: Parks (Green Space)Polygon boundaries, official names, types.
- Parks & Recreation FacilitiesInventory of in-park amenities (washrooms, fields, rinks…).
- Toronto Pedestrian NetworkSidewalk segments around and through parks; estimated park entrances.
- Toronto Centreline V2Street segments + intersection nodes near park edges; trails and walkways.
- Toronto 3D MassingBuilding footprints + heights for edge-building counts, frontage density, and tower-in-the-park risk.
- Toronto Treed AreaTree canopy share inside park polygons via stratified-grid sampling.
- Toronto Waterbodies & RiversWater surface inside parks + nearest-water distance for cooling.
- Ravine & Natural Feature ProtectionRavine overlap as a cooling / natural-comfort signal.
- Toronto Street Tree InventoryTree count + density inside park polygons.
- Neighbourhood Profiles(Pending) Equity context proxy.
- OpenStreetMap (Overpass API)Cafés, restaurants, retail, transit stops, parking, highways, rail.