Sally Bird Park
Urban Plaza, in the top tier overall (score 45, rank ~90th percentile). Strongest: edge activation; weakest: natural comfort.
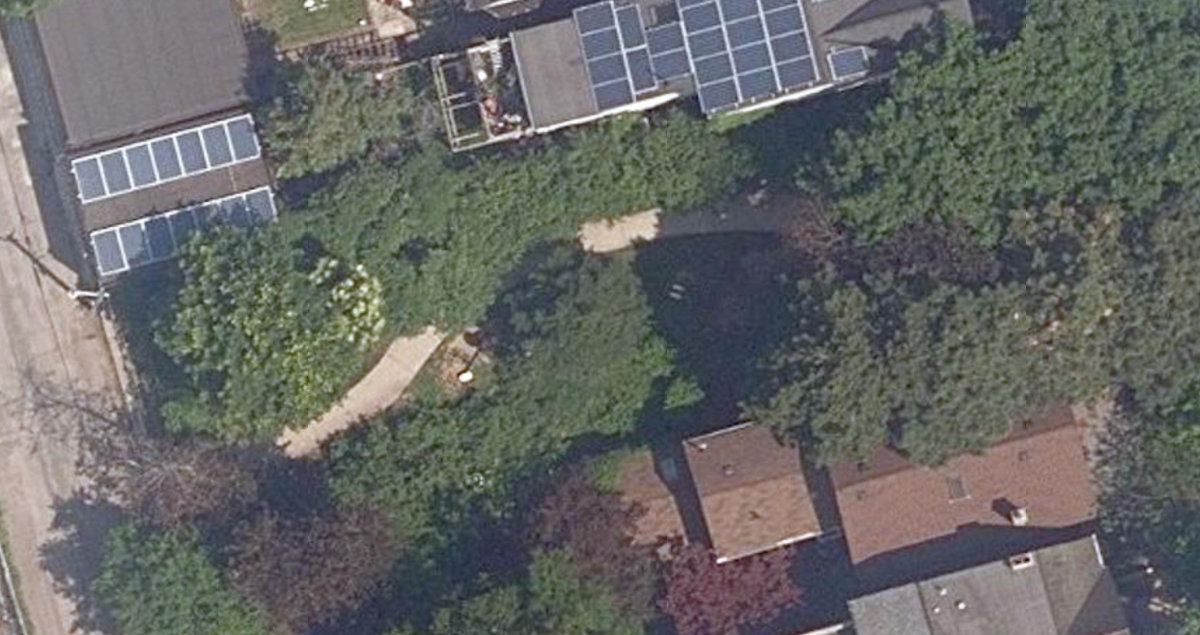
Aerial, City of Toronto orthophoto, ~8 cm/px source · cached 5/9/2026
Sally Bird Park scores 45.4 / 100. Strongest dimensions: enclosure / eyes on park and connectivity. Weakest: amenity diversity (10.7). Border-vacuum risk is low. This score is a transparent reading of Jane Jacobs-style vitality factors, not a definitive judgment.
Area · 0.04 ha
Weighted across six dimensions · confidence 61%
Scores are not bell-curved. Percentiles and expected scores provide context without changing the underlying model.
Loading map…
The parks map is loading.Explain this score
Where did the 45 come from? Each weighted contribution against a neutral 50 baseline. Green = pushed up; red = pulled down.
Sum of contributions = the headline score. A negative bar means that dimension dragged the park below the city-wide neutral baseline.
Why this park works
Sally Bird Park works because its edge activation score (47) is in the top tier and its enclosure (87) is also top decile.
What limits this park
Sally Bird Park is held back by natural comfort (31, bottom quartile): only 0% canopy means little summer shade.
Most distinctive characteristic
Most distinctive feature: exceptionally high edge activation (47, top decile).
Jacobs reading
Sally Bird Park sits between an urban social park and an ecological retreat: moderately useful for both, exceptionally suited to neither.
Performance in context
- A modest overperformer for its urban plaza typology (+9 vs the median in pocket Urban Plaza).
Typology classification
Classified as Urban Plaza: 419 m², paved (0% canopy), 63.0 buildings/100 m
Edge Activation
Within 100 m of the park edge: 10 active uses (restaurant, transit_stop, retail, cafe) and 2 dead/hostile uses (parking_lot). Active edges keep "eyes on the park" through the day; parking lots, blank institutional walls, rail and highway frontages drain street life.
Source: OSM POIs (amenity/shop) + Toronto Building Footprints + land use
Connectivity
Connectivity blends paths, intersections, transit, entrances, and edge density. This park has 1 mapped paths/walkways and 0 sidewalk segments within 50 m; 7 street intersections within 100 m; 23 transit stops within a 400 m walk; 1 estimated access points across ~96 m of perimeter. edge density is healthy, no superblock penalty. Source coverage: centreline, transit_osm.
Source: Toronto Centreline V2 + Pedestrian Network + OSM transit stops
Amenity Diversity
1 distinct amenity types in the park (fitness). Diversity, not raw count, drives the score so a park with many distinct activity types can outrank a larger park that repeats the same use.
Source: Toronto Parks & Recreation Facilities + OSM amenity tags
Natural Comfort
Natural-comfort components for this park: 0.0% estimated tree canopy; 1 city-mapped trees inside the polygon (1.0/ha). Reading: exposed. Source coverage: street_trees. Impervious surface is approximated (Toronto's authoritative layer ships only as a raster GeoTIFF).
Source: Toronto Treed Area + Ravine + Waterbodies + Street Tree Inventory
Enclosure / Eyes on Park
63 buildings within 25 m of the park edge (9 mid-rise, 54 low-rise, 0 tower); avg edge height 7.5 m (~3 floors); 63.0 buildings per 100 m of 96 m perimeter (strong frontage density); edges are low-rise (mostly 2 to 3 floors); no towers immediately adjacent. "Eyes on the park" come strongest from the 9 mid-rise edge buildings.
Source: Toronto 3D Massing (building footprints + heights)
Border Vacuum Risk
Border-vacuum factors within 50 m of the park: parking_lot. Jacobs warned that highways, rail, parking lots and blank institutional edges act as "vacuums" that suppress foot traffic and isolate the park from its neighbourhood.
Source: Toronto Street Centreline (highways) + rail layer + OSM landuse + building footprints
Equity Context
Equity Context requires inputs not yet loaded for this park (Toronto Neighbourhood Profiles). Score is held at a neutral 50 with low confidence. Read with caution.
Source: Toronto Neighbourhood Profiles
Amenities (1 types · 1 records)
- fitness
Nearby active-edge features (24)
- parking lot31 m
- retail: COIN O RAMA Laundromat59 m
- retail: Clay Design59 m
- parking lot67 m
- transit stop69 m
- retail: The Rock Store69 m
- transit stop: Brunswick Avenue80 m
- cafe: Pedaal84 m
- restaurant: Matha Roti85 m
- restaurant: Harbord Fish & Chips85 m
- retail: The Curl Ambassador91 m
- retail: Emmer93 m
- retail106 m
- parking lot114 m
- school: ALPHA II Alternative School115 m
- restaurant: Akai122 m
- retail: Brow Artisto123 m
- retail: Lori Eisler150 m
- restaurant: Her Father's Cider Bar + Kitchen151 m
- retail: Things Japanese152 m
- retail: Harbord Bakery & Calandria161 m
- restaurant: Pizza Gigi170 m
- restaurant: rasa189 m
- restaurant: Pizza Nova196 m
Park profile
Five-axis radar across the structural dimensions.
Citywide percentile ranks
Across all Toronto parks in the dataset.
- Overall vitality90th
- Edge activation95th
- Connectivity50th
- Amenity diversity70th
- Natural comfort14th
- Enclosure93th
Most similar parks
Closest in metric space across the five structural dimensions.
- Northumberland PlaygroundUrban Plaza46
- Lisgar ParkUrban Plaza47
- Bright Street PlaygroundUrban Plaza48
- MACKENZIE HOUSE - Building GroundsUrban Plaza41
- BARBARA FRUM COMMUNITY CENTRE - Building GroundsUrban Plaza44
Most opposite parks
Furthest in metric space. Useful for recognising what kind of park this isn’t.
- Trca Lands ( 26)Ravine / Naturalized Park27
- Toronto Islands - Muggs Island ParkRavine / Naturalized Park25
- Rouge ParkRavine / Naturalized Park28
- Rouge ParkWaterfront Park25
- Rouge ParkRavine / Naturalized Park26
Human activity signals: not available
No activity signals have landed for this park yet. The model has scored its physical form but it can’t yet say how often it’s programmed, photographed, or walked through. See /data-ethics for what we will and will not collect.
Does this score feel accurate?
Your read of Sally Bird Parkmatters. We’re testing whether the model lines up with how people actually use the park. Submissions are stored locally; no account needed.
Tell us how this park feels
We measure structure (canopy, edges, connectivity). You measure feeling. Both matter, and disagreement is itself useful civic data.
What would improve this park?
Generated from the weakest measured dimensions: a starting point, not a prescription.
- Activate the edges: encourage cafés, retail or community uses on the streets that face the park; replace blank or parking-lot edges where possible.
- Add or open more entrances and improve sidewalk continuity around the park. More permeability means more spontaneous use.
- Diversify what people can do in the park (playground, washroom, water, shade, performance, sport, garden): even small additions raise this score.
- Increase canopy and reduce paved area. Shade and water features extend usable hours and seasons.
Data sources
- City of Toronto Open Data: Parks (Green Space)Polygon boundaries, official names, types.
- Parks & Recreation FacilitiesInventory of in-park amenities (washrooms, fields, rinks…).
- Toronto Pedestrian NetworkSidewalk segments around and through parks; estimated park entrances.
- Toronto Centreline V2Street segments + intersection nodes near park edges; trails and walkways.
- Toronto 3D MassingBuilding footprints + heights for edge-building counts, frontage density, and tower-in-the-park risk.
- Toronto Treed AreaTree canopy share inside park polygons via stratified-grid sampling.
- Toronto Waterbodies & RiversWater surface inside parks + nearest-water distance for cooling.
- Ravine & Natural Feature ProtectionRavine overlap as a cooling / natural-comfort signal.
- Toronto Street Tree InventoryTree count + density inside park polygons.
- Neighbourhood Profiles(Pending) Equity context proxy.
- OpenStreetMap (Overpass API)Cafés, restaurants, retail, transit stops, parking, highways, rail.