Main Sewage Treatment Playground
Neighbourhood Park, middle of the pack overall (score 31, rank ~35th percentile). Strongest: connectivity; weakest: enclosure.
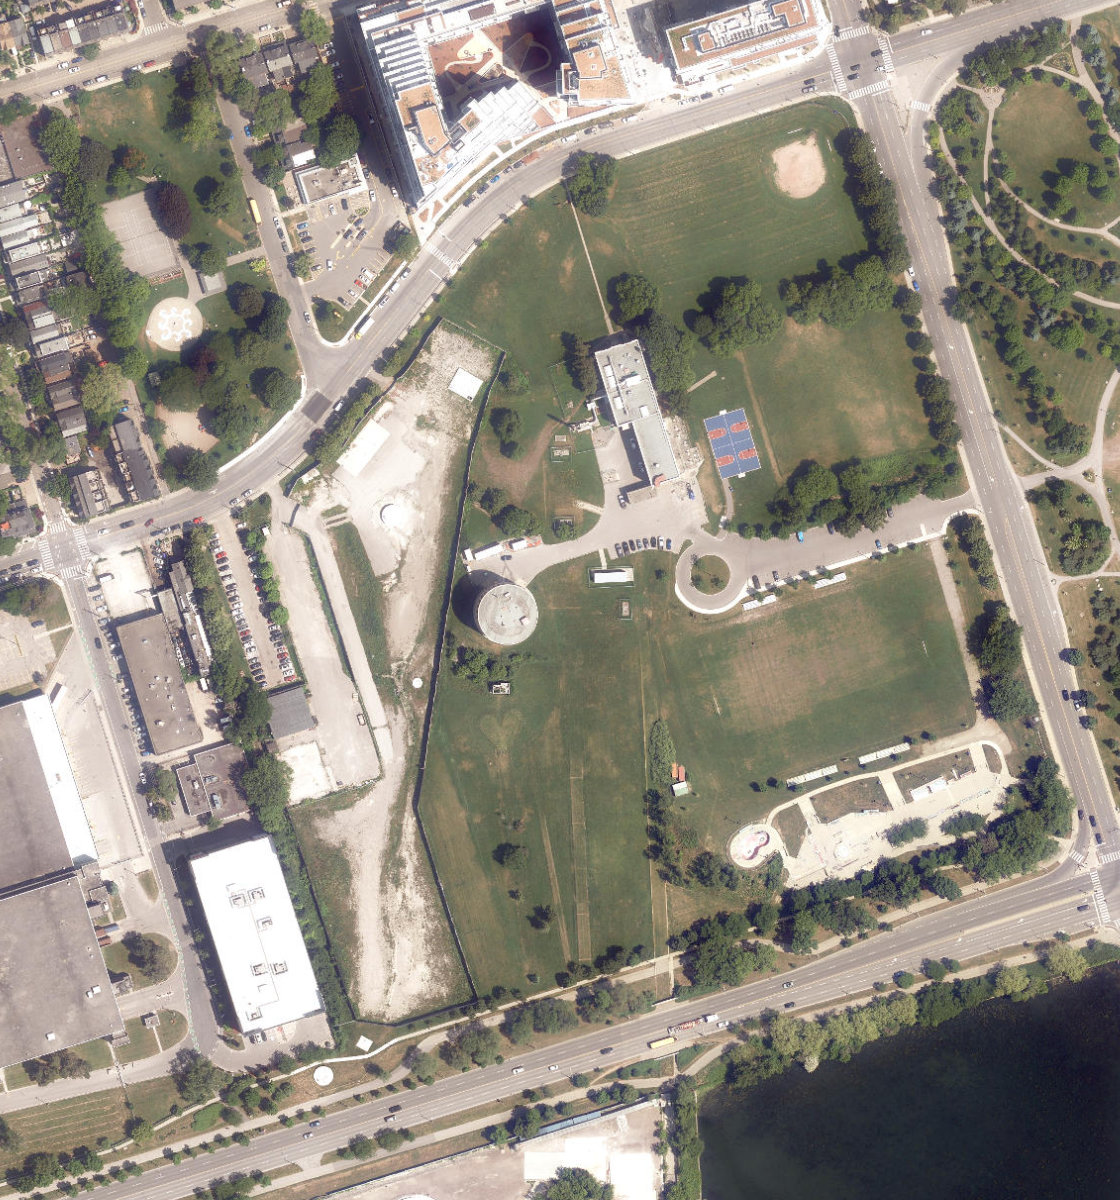
Aerial, City of Toronto orthophoto, ~8 cm/px source · cached 5/9/2026
Main Sewage Treatment Playground scores 30.9 / 100. Strongest dimensions: connectivity and enclosure / eyes on park. Weakest: edge activation (0). Border-vacuum risk is elevated (100). This score is a transparent reading of Jane Jacobs-style vitality factors, not a definitive judgment.
Area · 9.99 ha
Weighted across six dimensions · confidence 68%
Scores are not bell-curved. Percentiles and expected scores provide context without changing the underlying model.
Loading map…
The parks map is loading.Explain this score
Where did the 31 come from? Each weighted contribution against a neutral 50 baseline. Green = pushed up; red = pulled down.
Sum of contributions = the headline score. A negative bar means that dimension dragged the park below the city-wide neutral baseline.
Why this park works
Main Sewage Treatment Playground works because its connectivity score (76) is one of the city's strongest and its amenity diversity (21) is also top quartile (18 transit stops sit within a 400 m walk; 17 intersections fall within 100 m of the edge).
What limits this park
Main Sewage Treatment Playground is held back by enclosure (59, below-average); border-vacuum risk is also elevated (100).
Most distinctive characteristic
Most distinctive feature: exceptionally high connectivity (76, top decile).
Jacobs reading
Main Sewage Treatment Playground sits between an urban social park and an ecological retreat: moderately useful for both, exceptionally suited to neither.
Tradeoffs
- Connectivity (76) significantly outpaces natural comfort (38): well placed in the city but offers little shade or ecological respite.
- High connectivity coexists with high border-vacuum risk (100): much of that connectivity is to highways, rail, or parking lots, not to neighbourhoods.
Typology classification
Classified as Neighbourhood Park: 10.0 ha, framed by 9 mid-rise vs 0 towers
Edge Activation
Within 100 m of the park edge: 10 active uses (transit_stop, retail, restaurant) and 18 dead/hostile uses (parking_lot, highway). Active edges keep "eyes on the park" through the day; parking lots, blank institutional walls, rail and highway frontages drain street life.
Source: OSM POIs (amenity/shop) + Toronto Building Footprints + land use
Connectivity
Connectivity blends paths, intersections, transit, entrances, and edge density. This park has 27 mapped paths/walkways and 48 sidewalk segments within 50 m; 17 street intersections within 100 m; 18 transit stops within a 400 m walk; 7 estimated access points across ~1,342 m of perimeter. edge density is healthy, no superblock penalty. Source coverage: centreline, pedestrian_network, transit_osm.
Source: Toronto Centreline V2 + Pedestrian Network + OSM transit stops
Amenity Diversity
2 distinct amenity types in the park (basketball, sports_field). Diversity, not raw count, drives the score so a park with many distinct activity types can outrank a larger park that repeats the same use.
Source: Toronto Parks & Recreation Facilities + OSM amenity tags
Natural Comfort
Natural-comfort components for this park: ~3.1% effective canopy (0.0% from contiguous tree polygons + scattered tree density); nearest waterbody ~221 m; 44 city-mapped trees inside the polygon (4.4/ha). Reading: exposed. Source coverage: waterbodies, street_trees. Impervious surface is approximated (Toronto's authoritative layer ships only as a raster GeoTIFF).
Source: Toronto Treed Area + Ravine + Waterbodies + Street Tree Inventory
Enclosure / Eyes on Park
29 buildings within 25 m of the park edge (9 mid-rise, 20 low-rise, 0 tower); avg edge height 8.1 m (~3 floors); 2.2 buildings per 100 m of 1,342 m perimeter (moderate frontage density); edges are low-rise (mostly 2 to 3 floors); no towers immediately adjacent. "Eyes on the park" come strongest from the 9 mid-rise edge buildings.
Source: Toronto 3D Massing (building footprints + heights)
Border Vacuum Risk
Border-vacuum factors within 50 m of the park: parking_lot, Emdaabiimok Avenue, parking_lot, Lake Shore Boulevard East, Emdaabiimok Avenue, parking_lot, parking_lot, Emdaabiimok Avenue. Jacobs warned that highways, rail, parking lots and blank institutional edges act as "vacuums" that suppress foot traffic and isolate the park from its neighbourhood.
Source: Toronto Street Centreline (highways) + rail layer + OSM landuse + building footprints
Equity Context
Equity Context requires inputs not yet loaded for this park (Toronto Neighbourhood Profiles). Score is held at a neutral 50 with low confidence. Read with caution.
Source: Toronto Neighbourhood Profiles
Amenities (2 types · 2 records)
- basketball
- sports field
Nearby active-edge features (65)
- restaurant: Rorschach Brewing0 m
- parking lot0 m
- parking lot0 m
- parking lot0 m
- highway: Emdaabiimok Avenue14 m
- highway: Emdaabiimok Avenue14 m
- highway: Emdaabiimok Avenue15 m
- highway: Lake Shore Boulevard East23 m
- parking lot24 m
- transit stop: Emdaabiimok Avenue41 m
- highway: Eastern Avenue55 m
- transit stop: Queen Street East60 m
- highway: Emdaabiimok Avenue65 m
- parking lot69 m
- transit stop: Connaught Avenue87 m
- highway: Lake Shore Boulevard East87 m
- retail: Good Earth Coffee House87 m
- parking lot88 m
- highway: Lake Shore Boulevard East91 m
- parking lot: Canada Post parking91 m
- retail: Money Mart91 m
- retail: Ambrosia92 m
- highway: Lake Shore Boulevard East93 m
- highway: Emdaabiimok Avenue94 m
- retail94 m
- retail: Medicine Wheel95 m
- transit stop: Connaught Avenue96 m
- highway: Lake Shore Boulevard East98 m
- highway: Eastern Avenue105 m
- transit stop: Coxwell Avenue106 m
- parking lot114 m
- transit stop: Coxwell Avenue116 m
- restaurant: Jaclyn's118 m
- retail: Production Walkies118 m
- retail: DT Aquarium119 m
- retail: Poodle & Co Groomer119 m
- restaurant: Shawarma Day120 m
- retail: Wonderland Cannabis120 m
- retail: Park Discount121 m
- restaurant: Dirty Birrias121 m
- restaurant: Smacks Burger Bar121 m
- retail: Velotique124 m
- restaurant: Pizza Nova127 m
- retail: The Anderson Press127 m
- retail: Maya's Market & Convenience128 m
- restaurant: Bandito Burritos128 m
- retail: Vape Shop132 m
- transit stop: Queen Street East136 m
- parking lot137 m
- retail: Studio 505137 m
- retail: Dimensions Custom Framing & Gallery142 m
- restaurant: O Sushi143 m
- retail: Dulcinella146 m
- retail: Ethical Local Market146 m
- transit stop: Queen Street East150 m
- parking lot151 m
- parking lot: Impark153 m
- restaurant: Holi Taco163 m
- retail: Simple Coffee166 m
- restaurant: Harvey's167 m
- parking lot170 m
- retail: Salim’s Auto Repair181 m
- retail: Up To You187 m
- restaurant: Casa di Giorgio191 m
- restaurant: Chick-N-Joy192 m
Park profile
Five-axis radar across the structural dimensions.
Citywide percentile ranks
Across all Toronto parks in the dataset.
- Overall vitality35th
- Edge activation36th
- Connectivity96th
- Amenity diversity88th
- Natural comfort33th
- Enclosure29th
Most similar parks
Closest in metric space across the five structural dimensions.
- Port Royal ParkNeighbourhood Park39
- Horseley Hill ParkNeighbourhood Park43
- Chartwell ParkNeighbourhood Park40
- Shawnee ParkNeighbourhood Park42
- Clairlea ParkNeighbourhood Park39
Most opposite parks
Furthest in metric space. Useful for recognising what kind of park this isn’t.
- Joseph Burr Tyrrell ParkUrban Plaza50
- Manor Community GreenUrban Plaza57
- Market Lane ParkUrban Plaza63
- Simcoe ParkTower-Community Green Space51
- Trca Lands ( 26)Ravine / Naturalized Park27
Human activity signals: not available
No activity signals have landed for this park yet. The model has scored its physical form but it can’t yet say how often it’s programmed, photographed, or walked through. See /data-ethics for what we will and will not collect.
Does this score feel accurate?
Your read of Main Sewage Treatment Playgroundmatters. We’re testing whether the model lines up with how people actually use the park. Submissions are stored locally; no account needed.
Tell us how this park feels
We measure structure (canopy, edges, connectivity). You measure feeling. Both matter, and disagreement is itself useful civic data.
What would improve this park?
Generated from the weakest measured dimensions: a starting point, not a prescription.
- Activate the edges: encourage cafés, retail or community uses on the streets that face the park; replace blank or parking-lot edges where possible.
- Diversify what people can do in the park (playground, washroom, water, shade, performance, sport, garden): even small additions raise this score.
- Increase canopy and reduce paved area. Shade and water features extend usable hours and seasons.
- Mitigate border vacuums (highways, rail, parking) with active programming on the still-permeable edges and treat the hostile edge as a design challenge.
Data sources
- City of Toronto Open Data: Parks (Green Space)Polygon boundaries, official names, types.
- Parks & Recreation FacilitiesInventory of in-park amenities (washrooms, fields, rinks…).
- Toronto Pedestrian NetworkSidewalk segments around and through parks; estimated park entrances.
- Toronto Centreline V2Street segments + intersection nodes near park edges; trails and walkways.
- Toronto 3D MassingBuilding footprints + heights for edge-building counts, frontage density, and tower-in-the-park risk.
- Toronto Treed AreaTree canopy share inside park polygons via stratified-grid sampling.
- Toronto Waterbodies & RiversWater surface inside parks + nearest-water distance for cooling.
- Ravine & Natural Feature ProtectionRavine overlap as a cooling / natural-comfort signal.
- Toronto Street Tree InventoryTree count + density inside park polygons.
- Neighbourhood Profiles(Pending) Equity context proxy.
- OpenStreetMap (Overpass API)Cafés, restaurants, retail, transit stops, parking, highways, rail.