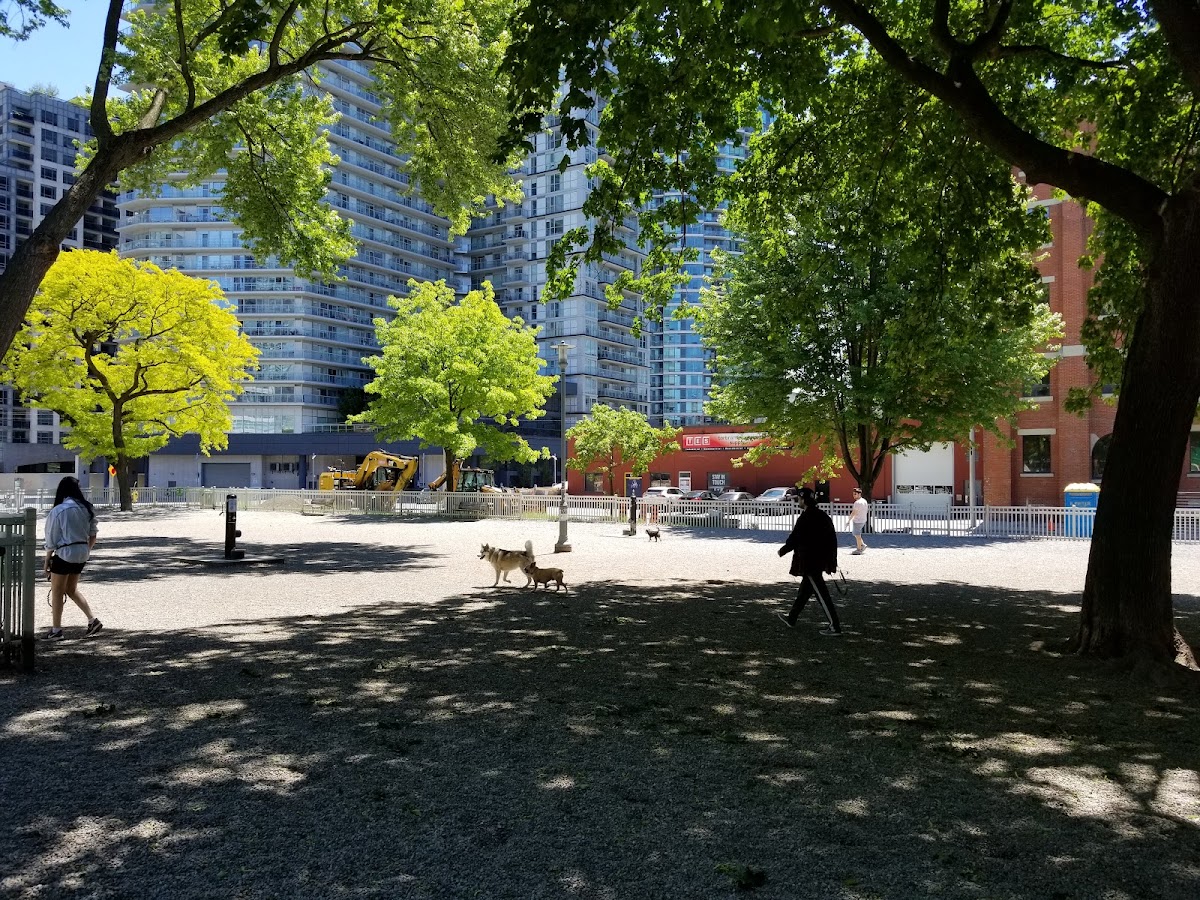
Clarence Square Park
Civic Square, above average overall (score 42, rank ~81th percentile). Strongest: connectivity; weakest: edge activation.
Photo by Chuan Chee via Google Places · cached 5/9/2026
Clarence Square Park scores 41.5 / 100. Strongest dimensions: connectivity and enclosure / eyes on park. Weakest: edge activation (0). Border-vacuum risk is low. This score is a transparent reading of Jane Jacobs-style vitality factors, not a definitive judgment.
Area · 0.76 ha
Weighted across six dimensions · confidence 68%
Scores are not bell-curved. Percentiles and expected scores provide context without changing the underlying model.
Loading map…
The parks map is loading.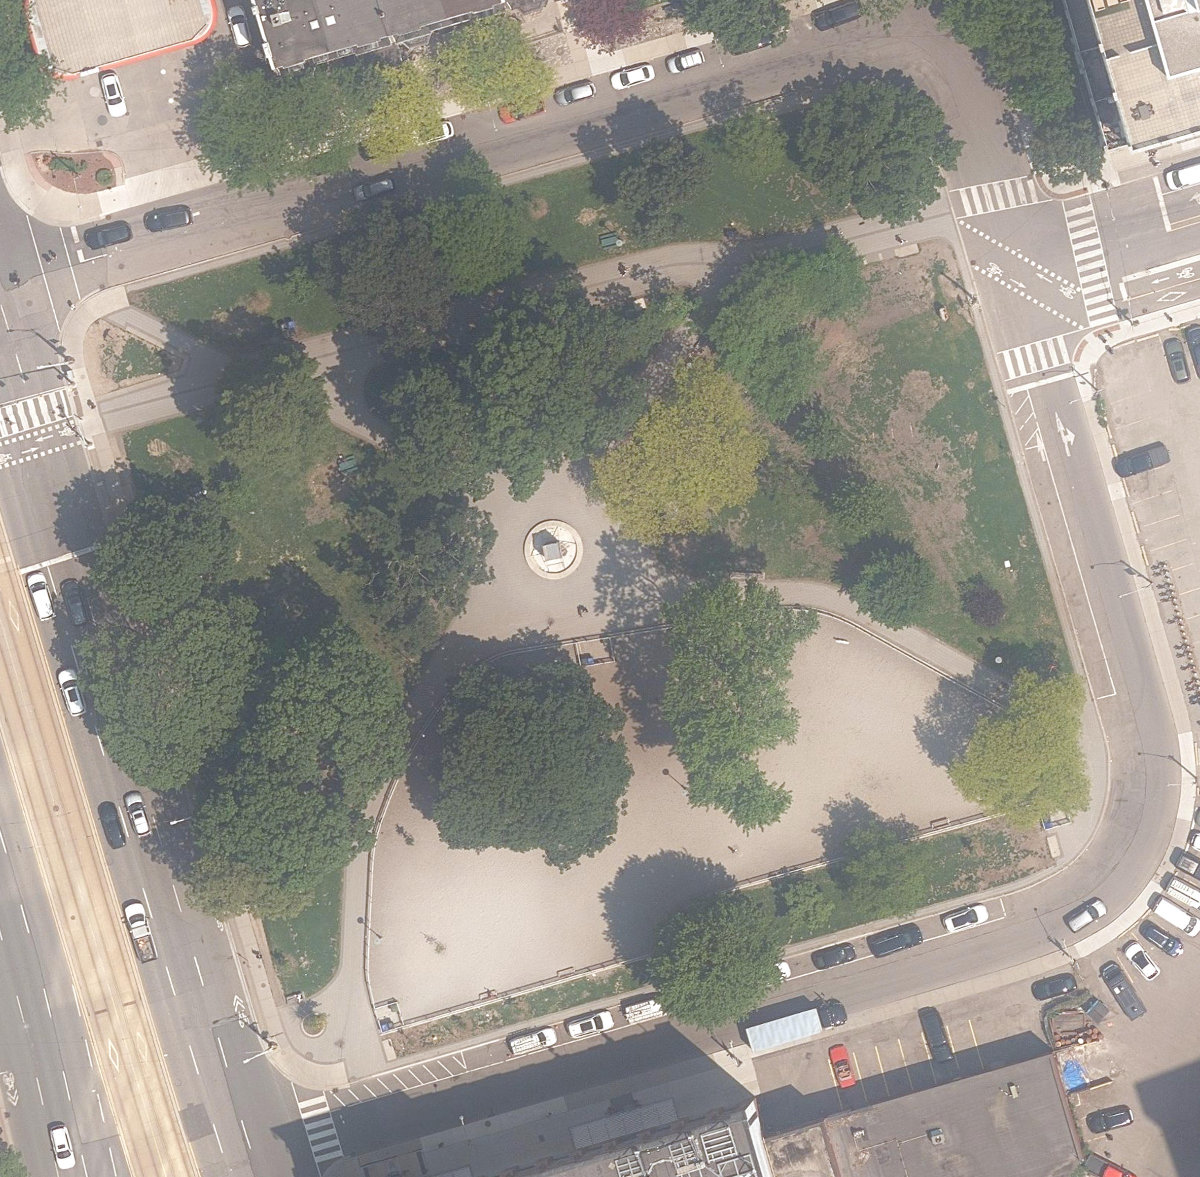
Explain this score
Where did the 42 come from? Each weighted contribution against a neutral 50 baseline. Green = pushed up; red = pulled down.
Sum of contributions = the headline score. A negative bar means that dimension dragged the park below the city-wide neutral baseline.
Why this park works
Clarence Square Park works because its connectivity score (78) is one of the city's strongest and its amenity diversity (12) is also above-average (15 transit stops sit within a 400 m walk; 15 intersections fall within 100 m of the edge).
What limits this park
Clarence Square Park is held back by edge activation (0, below-average): the surrounding streets carry too few active uses to spill into the park.
Most distinctive characteristic
Most distinctive feature: exceptionally high connectivity (78, top decile).
Jacobs reading
Clarence Square Park sits between an urban social park and an ecological retreat: moderately useful for both, exceptionally suited to neither.
Tradeoffs
- The park is enclosed by buildings (66) but the surrounding streets are quiet (edge activation 0): frame without animation.
Performance in context
- Citywide rank is high (81st) but typology rank is more modest (61st): the strength likely comes from the dataset average pulling lower than this typology’s baseline.
Typology classification
Classified as Civic Square: name flags as civic square + 45 buildings frame the edge
Edge Activation
Within 100 m of the park edge: 11 active uses (transit_stop, retail, cafe) and 9 dead/hostile uses (parking_lot). Active edges keep "eyes on the park" through the day; parking lots, blank institutional walls, rail and highway frontages drain street life.
Source: OSM POIs (amenity/shop) + Toronto Building Footprints + land use
Connectivity
Connectivity blends paths, intersections, transit, entrances, and edge density. This park has 12 mapped paths/walkways and 29 sidewalk segments within 50 m; 15 street intersections within 100 m; 15 transit stops within a 400 m walk; 11 estimated access points across ~339 m of perimeter. edge density is healthy, no superblock penalty. Source coverage: centreline, pedestrian_network, transit_osm.
Source: Toronto Centreline V2 + Pedestrian Network + OSM transit stops
Amenity Diversity
1 distinct amenity types in the park (dog_area). Diversity, not raw count, drives the score so a park with many distinct activity types can outrank a larger park that repeats the same use.
Source: Toronto Parks & Recreation Facilities + OSM amenity tags
Natural Comfort
Natural-comfort components for this park: ~23.1% effective canopy (0.0% from contiguous tree polygons + scattered tree density); nearest waterbody ~682 m; 33 city-mapped trees inside the polygon (33.0/ha). Reading: exposed. Source coverage: waterbodies, street_trees. Impervious surface is approximated (Toronto's authoritative layer ships only as a raster GeoTIFF).
Source: Toronto Treed Area + Ravine + Waterbodies + Street Tree Inventory
Enclosure / Eyes on Park
45 buildings within 25 m of the park edge (19 mid-rise, 9 low-rise, 17 tower); avg edge height 43.4 m (~14 floors); 13.3 buildings per 100 m of 339 m perimeter (strong frontage density); edges dominated by towers; 17 towers ≥ 40 m within 25 m of the edge. "Eyes on the park" come strongest from the 19 mid-rise edge buildings.
Source: Toronto 3D Massing (building footprints + heights)
Border Vacuum Risk
Border-vacuum factors within 50 m of the park: parking_lot. Jacobs warned that highways, rail, parking lots and blank institutional edges act as "vacuums" that suppress foot traffic and isolate the park from its neighbourhood.
Source: Toronto Street Centreline (highways) + rail layer + OSM landuse + building footprints
Equity Context
Equity Context requires inputs not yet loaded for this park (Toronto Neighbourhood Profiles). Score is held at a neutral 50 with low confidence. Read with caution.
Source: Toronto Neighbourhood Profiles
Amenities (1 types · 1 records)
- dog area
Nearby active-edge features (80)
- retail: LCBO23 m
- parking lot33 m
- retail: Value Buds33 m
- retail: Neighbours47 m
- parking lot54 m
- parking lot57 m
- transit stop: Front Street West59 m
- cafe: De Mello Coffee at The Well64 m
- retail: Shell Select64 m
- parking lot64 m
- cafe: Neo Coffee Bar71 m
- transit stop: Front Street West78 m
- parking lot80 m
- parking lot82 m
- retail: Blunt & Cherry Cannabis85 m
- cafe: De Mello Coffee85 m
- parking lot86 m
- retail: Black Rooster Decor93 m
- parking lot97 m
- parking lot98 m
- retail: Structube101 m
- retail101 m
- restaurant: Domino's106 m
- retail: Design Republic106 m
- restaurant: Sen5es106 m
- retail: Adidas107 m
- restaurant: Libra Lounge107 m
- parking lot109 m
- restaurant: Walhburgers110 m
- retail: Bulk Barn112 m
- restaurant: Bar Hop113 m
- restaurant: Thai Princess113 m
- restaurant: Bloke113 m
- restaurant: Fat Bastard Burrito119 m
- cafe: Tim Hortons120 m
- restaurant: Pizza Pizza123 m
- retail: Nuvo Nails124 m
- retail: The UPS Store125 m
- transit stop: Spadina Avenue126 m
- cafe: The Coffee126 m
- retail: Vanilla Bite Bakery126 m
- restaurant: Labora129 m
- cafe: Tim Hortons130 m
- retail: Crumbl131 m
- restaurant: Pizza Nova134 m
- restaurant: Annalakshmi134 m
- retail: Foodlane136 m
- restaurant: Pizza Rustica Restaurant & Bar136 m
- retail138 m
- retail: Aisle 24 Market138 m
- restaurant: Brassaii139 m
- retail: SOMA chocolatemaker140 m
- retail: Fresh & Wild Food Market141 m
- restaurant: Wayne Gretzky's141 m
- retail: Noah's Natural Foods142 m
- community: The Second City Training Centre143 m
- retail: Waxon143 m
- cafe: Calli Love143 m
- restaurant: Underground Garage147 m
- retail: Sky Dry Cleaners148 m
- restaurant: Chipotle149 m
- parking lot150 m
- restaurant: SPiN151 m
- restaurant: The Carbon Snack Bar151 m
- transit stop: Spadina Avenue155 m
- rail156 m
- retail: Rabba Fine Foods156 m
- transit stop: King Street West157 m
- retail157 m
- retail: Wellington Market159 m
- restaurant: Food Emporium159 m
- restaurant: Wendy's160 m
- restaurant: MARBL164 m
- rail164 m
- retail: Fluid Hair Studio + Spa166 m
- parking lot166 m
- restaurant: Oasis Rooftop Lounge168 m
- rail173 m
- parking lot173 m
- restaurant: 259 host ...a fine indian restaurant173 m
Park profile
Five-axis radar across the structural dimensions.
Citywide percentile ranks
Across all Toronto parks in the dataset.
- Overall vitality81th
- Edge activation30th
- Connectivity97th
- Amenity diversity74th
- Natural comfort67th
- Enclosure62th
Most similar parks
Closest in metric space across the five structural dimensions.
- Bridletowne ParkNeighbourhood Park41
- Brookbanks ParkRavine / Naturalized Park33
- Alex Marchetti ParkWaterfront Park37
- Port Union Village Common ParkCorridor / Linear Park39
- Wincott ParkWaterfront Park40
Most opposite parks
Furthest in metric space. Useful for recognising what kind of park this isn’t.
- Joseph Burr Tyrrell ParkUrban Plaza50
- Simcoe ParkTower-Community Green Space51
- Queen'S Quay Traffic IslandWaterfront Park49
- Manor Community GreenUrban Plaza57
- Bernard Avenue Road AllowanceUrban Plaza54
Visitor signals
Public attention measured by Google Places aggregates. This proxies attention, not occupancy. Aggregate-only: no usernames, no review text, no extra photos beyond the cached hero.
“Small tree-shaded urban park with a central cherub-topped fountain, an off-leash dog area & benches.” (Google editorial summary)
p89 citywide · p62 within Civic Square
Source: Google Places API · match high (1.00 composite confidence) · last refreshed 5/9/2026. Privacy contract. Measures public attention, not occupancy.
Human activity signals: not available
No activity signals have landed for this park yet. The model has scored its physical form but it can’t yet say how often it’s programmed, photographed, or walked through. See /data-ethics for what we will and will not collect.
Does this score feel accurate?
Your read of Clarence Square Parkmatters. We’re testing whether the model lines up with how people actually use the park. Submissions are stored locally; no account needed.
Tell us how this park feels
We measure structure (canopy, edges, connectivity). You measure feeling. Both matter, and disagreement is itself useful civic data.
What would improve this park?
Generated from the weakest measured dimensions: a starting point, not a prescription.
- Activate the edges: encourage cafés, retail or community uses on the streets that face the park; replace blank or parking-lot edges where possible.
- Diversify what people can do in the park (playground, washroom, water, shade, performance, sport, garden): even small additions raise this score.
Data sources
- City of Toronto Open Data: Parks (Green Space)Polygon boundaries, official names, types.
- Parks & Recreation FacilitiesInventory of in-park amenities (washrooms, fields, rinks…).
- Toronto Pedestrian NetworkSidewalk segments around and through parks; estimated park entrances.
- Toronto Centreline V2Street segments + intersection nodes near park edges; trails and walkways.
- Toronto 3D MassingBuilding footprints + heights for edge-building counts, frontage density, and tower-in-the-park risk.
- Toronto Treed AreaTree canopy share inside park polygons via stratified-grid sampling.
- Toronto Waterbodies & RiversWater surface inside parks + nearest-water distance for cooling.
- Ravine & Natural Feature ProtectionRavine overlap as a cooling / natural-comfort signal.
- Toronto Street Tree InventoryTree count + density inside park polygons.
- Neighbourhood Profiles(Pending) Equity context proxy.
- OpenStreetMap (Overpass API)Cafés, restaurants, retail, transit stops, parking, highways, rail.