Whitfield Parkette
Parkette, middle of the pack overall (score 37, rank ~65th percentile). Strongest: edge activation; weakest: natural comfort.
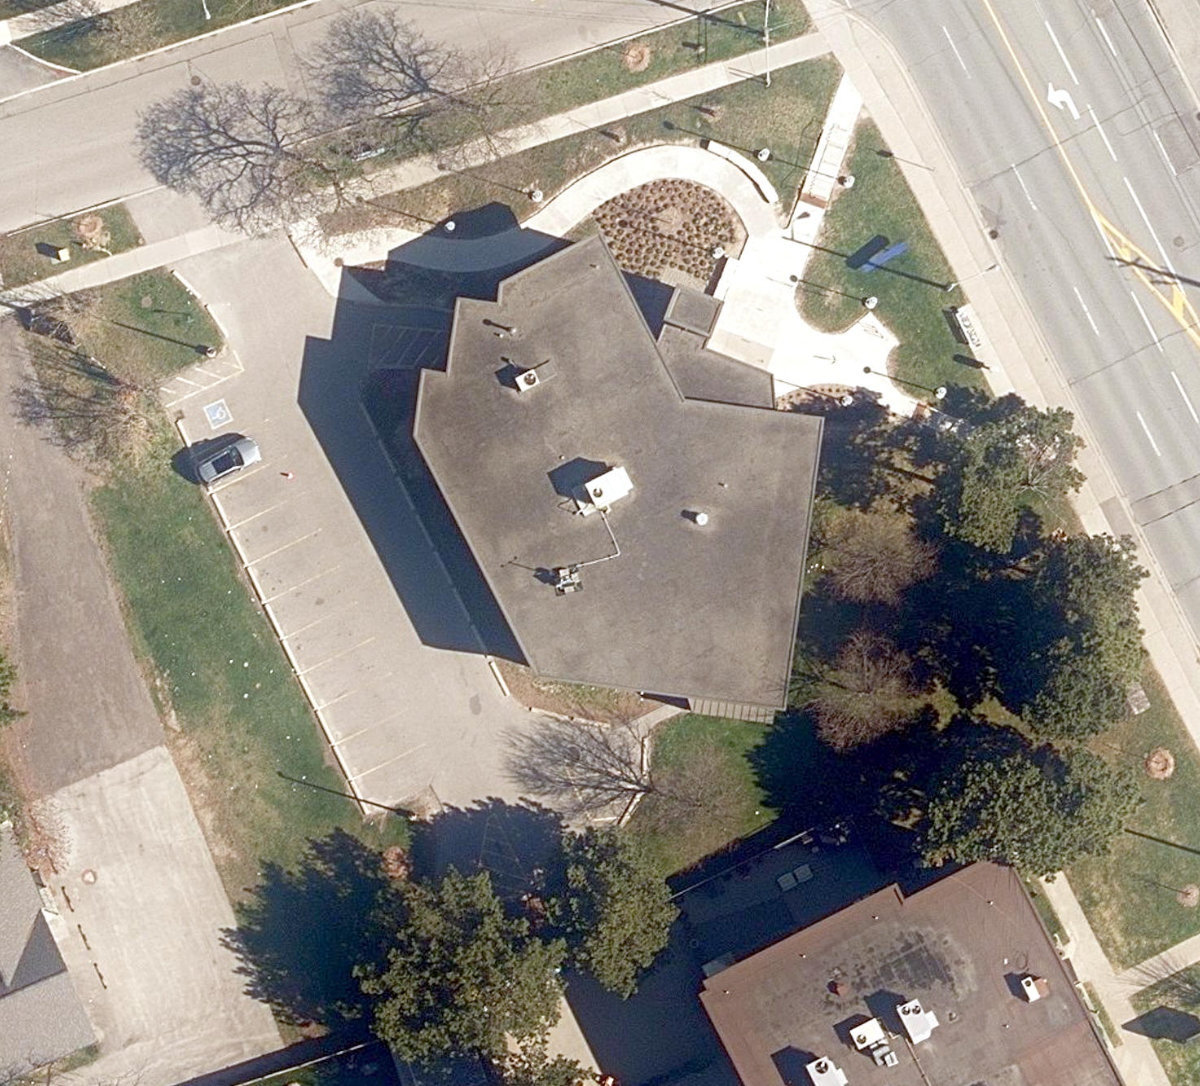
Aerial, City of Toronto orthophoto, ~8 cm/px source · cached 5/9/2026
Whitfield Parkette scores 37.4 / 100. Strongest dimensions: enclosure / eyes on park and edge activation. Weakest: amenity diversity (0). Border-vacuum risk is low. This score is a transparent reading of Jane Jacobs-style vitality factors, not a definitive judgment.
Area · 0.23 ha
Weighted across six dimensions · confidence 57%
Scores are not bell-curved. Percentiles and expected scores provide context without changing the underlying model.
Loading map…
The parks map is loading.Explain this score
Where did the 37 come from? Each weighted contribution against a neutral 50 baseline. Green = pushed up; red = pulled down.
Sum of contributions = the headline score. A negative bar means that dimension dragged the park below the city-wide neutral baseline.
Why this park works
Whitfield Parkette works because its edge activation score (40) is in the top tier and its enclosure (70) is also above-average.
What limits this park
Whitfield Parkette is held back by natural comfort (35, bottom quartile): only 0% canopy means little summer shade.
Most distinctive characteristic
Most distinctive feature: exceptionally high edge activation (40, top decile).
Jacobs reading
Whitfield Parkette sits between an urban social park and an ecological retreat: moderately useful for both, exceptionally suited to neither.
Performance in context
- A modest overperformer for its parkette typology (+6 vs the median in pocket Parkette).
Typology classification
Classified as Parkette: small (2295 m²) with strong building frontage (15.5 per 100 m)
Edge Activation
Within 100 m of the park edge: 24 active uses (transit_stop, retail, restaurant, cafe) and 5 dead/hostile uses (parking_lot). Active edges keep "eyes on the park" through the day; parking lots, blank institutional walls, rail and highway frontages drain street life.
Source: OSM POIs (amenity/shop) + Toronto Building Footprints + land use
Connectivity
Connectivity blends paths, intersections, transit, entrances, and edge density. This park has 0 mapped paths/walkways and 3 sidewalk segments within 50 m; 5 street intersections within 100 m; 7 transit stops within a 400 m walk; 0 estimated access points across ~193 m of perimeter. edge density is healthy, no superblock penalty. Source coverage: centreline, pedestrian_network, transit_osm.
Source: Toronto Centreline V2 + Pedestrian Network + OSM transit stops
Amenity Diversity
No amenities recorded. Score is 0 until inventory is loaded.
Source: Toronto Parks & Recreation Facilities + OSM amenity tags
Natural Comfort
Natural-comfort components for this park: ~1.4% effective canopy (0.0% from contiguous tree polygons + scattered tree density); nearest waterbody ~575 m; 2 city-mapped trees inside the polygon (2.0/ha). Reading: exposed. Source coverage: waterbodies, street_trees. Impervious surface is approximated (Toronto's authoritative layer ships only as a raster GeoTIFF).
Source: Toronto Treed Area + Ravine + Waterbodies + Street Tree Inventory
Enclosure / Eyes on Park
30 buildings within 25 m of the park edge (2 mid-rise, 28 low-rise, 0 tower); avg edge height 5.2 m (~2 floors); 15.5 buildings per 100 m of 193 m perimeter (strong frontage density); edges are barely there or single-storey; no towers immediately adjacent. "Eyes on the park" come strongest from the 2 mid-rise edge buildings.
Source: Toronto 3D Massing (building footprints + heights)
Border Vacuum Risk
Border-vacuum factors within 50 m of the park: parking_lot, parking_lot. Jacobs warned that highways, rail, parking lots and blank institutional edges act as "vacuums" that suppress foot traffic and isolate the park from its neighbourhood.
Source: Toronto Street Centreline (highways) + rail layer + OSM landuse + building footprints
Equity Context
Equity Context requires inputs not yet loaded for this park (Toronto Neighbourhood Profiles). Score is held at a neutral 50 with low confidence. Read with caution.
Source: Toronto Neighbourhood Profiles
Amenities (0)
No amenities recorded for this park.
Nearby active-edge features (55)
- parking lot0 m
- parking lot46 m
- retail: Sathuja's Chinna Kadai Fish & Meat Market50 m
- retail: Rajan's Beauty Salon51 m
- restaurant: Vangi Food53 m
- restaurant: Lucky Sweets & Restaurant54 m
- retail: 4U Milk Variety55 m
- retail: Diva Look56 m
- retail: 3J's Milk & Variety56 m
- retail: Cavallino Carne Equina56 m
- retail: H&P Food Products58 m
- retail: Ambika Jewelers58 m
- retail: Lionheart Coin Laundry61 m
- parking lot62 m
- retail: Galann Convenience63 m
- retail: Alex Hair Salon64 m
- parking lot65 m
- retail: Islington Travel Agencies68 m
- retail: York Party Rentals & Photo Studio69 m
- restaurant: Peppers Caribbean Restaurant72 m
- transit stop: Millwick Drive73 m
- retail: Casablance Florist76 m
- parking lot76 m
- retail: Magical Mash-Ups80 m
- cafe: Avellino Social Club85 m
- retail: Sal Hairstylists87 m
- retail: Ryna's Nails90 m
- retail: Cardillo's Hair Design98 m
- restaurant: Lupo Pizza & Slice99 m
- parking lot102 m
- transit stop: Muir Avenue102 m
- retail104 m
- retail: Comfort & Benessere105 m
- restaurant: Il Panino110 m
- parking lot114 m
- restaurant: Pho Ha Long Restaurant119 m
- retail: Dizaneau African Foods122 m
- restaurant: Las Calenas127 m
- parking lot127 m
- retail: The Hair Performers134 m
- retail: Capri Bakery137 m
- retail: Tee Shirt People138 m
- parking lot141 m
- retail: Humber Summit Cleaners141 m
- retail: Benjamin Moore146 m
- transit stop: Mullwick Drive at Plunkett Road149 m
- retail: Julie's Floral & Gifts151 m
- retail: Haley Nails and Spa156 m
- transit stop: Millwick Drive at Plunkett Road157 m
- retail: Domenic's Quality Meat160 m
- retail: Samar Wireless165 m
- retail: Angel's Convenience169 m
- restaurant: Pizza Hub176 m
- retail: Millwick Paint & Wallpaper179 m
- transit stop: Vanhill Avenue192 m
Park profile
Five-axis radar across the structural dimensions.
Citywide percentile ranks
Across all Toronto parks in the dataset.
- Overall vitality65th
- Edge activation92th
- Connectivity31th
- Amenity diversity38th
- Natural comfort21th
- Enclosure68th
Most similar parks
Closest in metric space across the five structural dimensions.
- Taylor Creek RavineRavine / Naturalized Park40
- City Wide Open SpaceUrban Plaza39
- Friars Lane BoulevardParkette39
- City Wide Open SpaceCivic Square39
- City Wide Open SpaceRavine / Naturalized Park39
Most opposite parks
Furthest in metric space. Useful for recognising what kind of park this isn’t.
- High ParkRavine / Naturalized Park47
- Trca Lands ( 26)Ravine / Naturalized Park27
- Rouge ParkRavine / Naturalized Park28
- Toronto Islands - Muggs Island ParkRavine / Naturalized Park25
- Rouge ParkWaterfront Park25
Human activity signals: not available
No activity signals have landed for this park yet. The model has scored its physical form but it can’t yet say how often it’s programmed, photographed, or walked through. See /data-ethics for what we will and will not collect.
Does this score feel accurate?
Your read of Whitfield Parkettematters. We’re testing whether the model lines up with how people actually use the park. Submissions are stored locally; no account needed.
Tell us how this park feels
We measure structure (canopy, edges, connectivity). You measure feeling. Both matter, and disagreement is itself useful civic data.
What would improve this park?
Generated from the weakest measured dimensions: a starting point, not a prescription.
- Activate the edges: encourage cafés, retail or community uses on the streets that face the park; replace blank or parking-lot edges where possible.
- Add or open more entrances and improve sidewalk continuity around the park. More permeability means more spontaneous use.
- Diversify what people can do in the park (playground, washroom, water, shade, performance, sport, garden): even small additions raise this score.
- Increase canopy and reduce paved area. Shade and water features extend usable hours and seasons.
Data sources
- City of Toronto Open Data: Parks (Green Space)Polygon boundaries, official names, types.
- Parks & Recreation FacilitiesInventory of in-park amenities (washrooms, fields, rinks…).
- Toronto Pedestrian NetworkSidewalk segments around and through parks; estimated park entrances.
- Toronto Centreline V2Street segments + intersection nodes near park edges; trails and walkways.
- Toronto 3D MassingBuilding footprints + heights for edge-building counts, frontage density, and tower-in-the-park risk.
- Toronto Treed AreaTree canopy share inside park polygons via stratified-grid sampling.
- Toronto Waterbodies & RiversWater surface inside parks + nearest-water distance for cooling.
- Ravine & Natural Feature ProtectionRavine overlap as a cooling / natural-comfort signal.
- Toronto Street Tree InventoryTree count + density inside park polygons.
- Neighbourhood Profiles(Pending) Equity context proxy.
- OpenStreetMap (Overpass API)Cafés, restaurants, retail, transit stops, parking, highways, rail.