Coronation Park - York
Ravine / Naturalized Park, middle of the pack overall (score 38, rank ~66th percentile). Strongest: amenity diversity; weakest: edge activation.
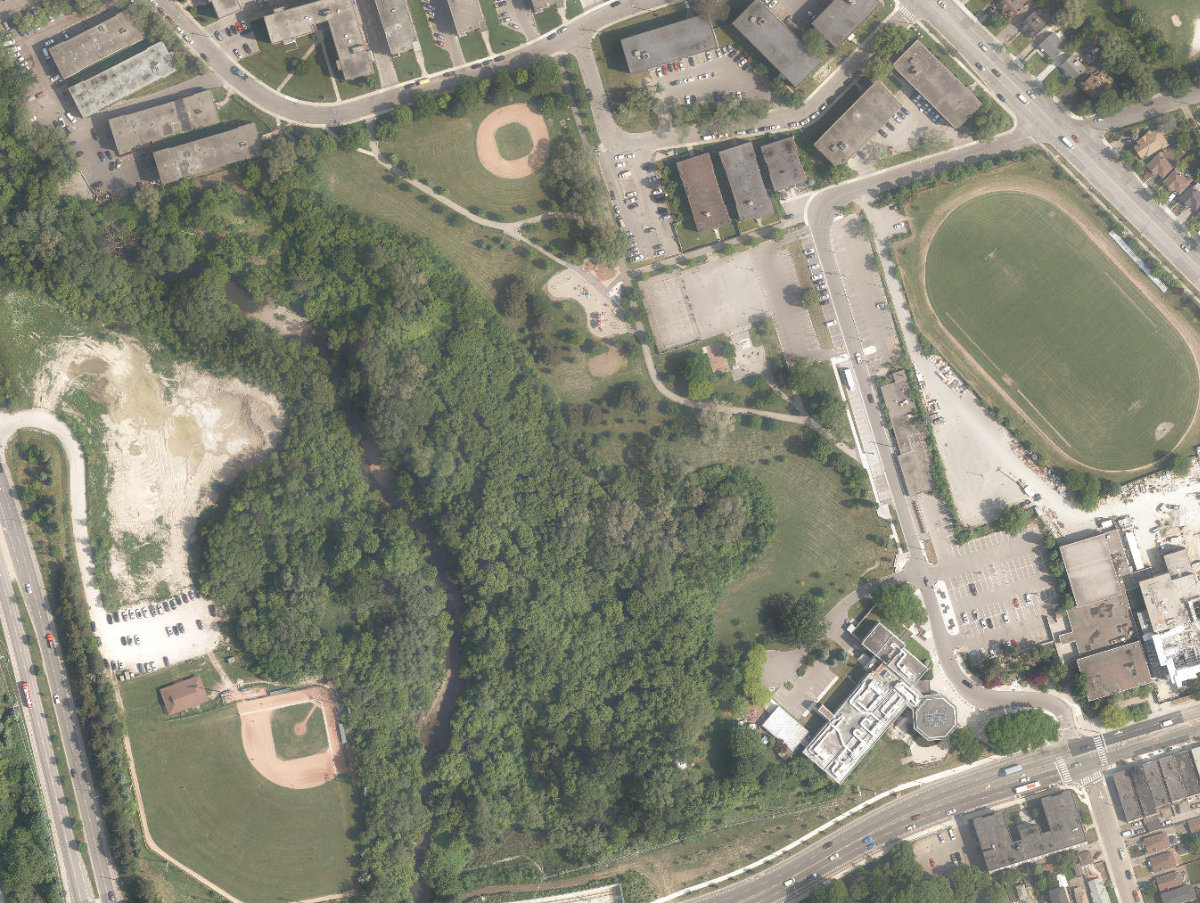
Aerial, City of Toronto orthophoto, ~8 cm/px source · cached 5/9/2026
Coronation Park - York scores 37.6 / 100. Strongest dimensions: connectivity and enclosure / eyes on park. Weakest: edge activation (0). Border-vacuum risk is elevated (100). This score is a transparent reading of Jane Jacobs-style vitality factors, not a definitive judgment.
Area · 8.60 ha
Weighted across six dimensions · confidence 72%
Scores are not bell-curved. Percentiles and expected scores provide context without changing the underlying model.
Loading map…
The parks map is loading.Explain this score
Where did the 38 come from? Each weighted contribution against a neutral 50 baseline. Green = pushed up; red = pulled down.
Sum of contributions = the headline score. A negative bar means that dimension dragged the park below the city-wide neutral baseline.
Why this park works
Coronation Park - York works because its amenity diversity score (39) is one of the city's strongest and its connectivity (73) is also top decile.
What limits this park
Coronation Park - York's edges are fronted by border-vacuum land uses (highways, rail, parking, blank institutional), risk score 100.
Most distinctive characteristic
Most distinctive feature: exceptionally high amenity diversity (39, top decile).
Jacobs reading
Coronation Park - York sits between an urban social park and an ecological retreat: moderately useful for both, exceptionally suited to neither.
Tradeoffs
- The park is enclosed by buildings (69) but the surrounding streets are quiet (edge activation 0): frame without animation.
- High connectivity coexists with high border-vacuum risk (100): much of that connectivity is to highways, rail, or parking lots, not to neighbourhoods.
Typology classification
Classified as Ravine / Naturalized Park: 55% ravine overlap, 8% canopy. Secondary read: Athletic / Recreation Park (60% of amenity types are athletic (basketball, sports_field, tennis)).
Edge Activation
Within 100 m of the park edge: 8 active uses (transit_stop, retail, restaurant) and 28 dead/hostile uses (rail, highway, parking_lot). Active edges keep "eyes on the park" through the day; parking lots, blank institutional walls, rail and highway frontages drain street life.
Source: OSM POIs (amenity/shop) + Toronto Building Footprints + land use
Connectivity
Connectivity blends paths, intersections, transit, entrances, and edge density. This park has 11 mapped paths/walkways and 38 sidewalk segments within 50 m; 11 street intersections within 100 m; 26 transit stops within a 400 m walk; 8 estimated access points across ~1,431 m of perimeter. moderate edge density, small superblock penalty applied. Source coverage: centreline, pedestrian_network, transit_osm.
Source: Toronto Centreline V2 + Pedestrian Network + OSM transit stops
Amenity Diversity
5 distinct amenity types in the park (basketball, fitness, playground, sports_field, tennis). Diversity, not raw count, drives the score so a park with many distinct activity types can outrank a larger park that repeats the same use.
Source: Toronto Parks & Recreation Facilities + OSM amenity tags
Natural Comfort
Natural-comfort components for this park: 8.2% estimated tree canopy; 54.6% inside the ravine system; 0.5% water surface; 96 city-mapped trees inside the polygon (11.2/ha). Reading: ravine-cooled. Source coverage: treed_area, ravine, waterbodies, street_trees. Impervious surface is approximated (Toronto's authoritative layer ships only as a raster GeoTIFF).
Source: Toronto Treed Area + Ravine + Waterbodies + Street Tree Inventory
Enclosure / Eyes on Park
74 buildings within 25 m of the park edge (21 mid-rise, 53 low-rise, 0 tower); avg edge height 6.7 m (~2 floors); 5.2 buildings per 100 m of 1,431 m perimeter (strong frontage density); edges are low-rise (mostly 2 to 3 floors); no towers immediately adjacent. "Eyes on the park" come strongest from the 21 mid-rise edge buildings.
Source: Toronto 3D Massing (building footprints + heights)
Border Vacuum Risk
Border-vacuum factors within 50 m of the park: parking_lot, Eglinton Avenue West, parking_lot, Line 5 Eglinton, Line 5 Eglinton, Eglinton Avenue West, Eglinton Avenue West, parking_lot, parking_lot, parking_lot, parking_lot, parking_lot, parking_lot, parking_lot. Jacobs warned that highways, rail, parking lots and blank institutional edges act as "vacuums" that suppress foot traffic and isolate the park from its neighbourhood.
Source: Toronto Street Centreline (highways) + rail layer + OSM landuse + building footprints
Equity Context
Equity Context requires inputs not yet loaded for this park (Toronto Neighbourhood Profiles). Score is held at a neutral 50 with low confidence. Read with caution.
Source: Toronto Neighbourhood Profiles
Amenities (5 types · 5 records)
- basketball
- fitness
- playground
- sports field
- tennis
Nearby active-edge features (74)
- parking lot0 m
- parking lot0 m
- parking lot0 m
- parking lot0 m
- parking lot0 m
- transit stop: Eglinton Avenue West at Municipal Drive2 m
- rail: Line 5 Eglinton9 m
- highway: Eglinton Avenue West12 m
- parking lot13 m
- highway: Eglinton Avenue West13 m
- rail: Line 5 Eglinton18 m
- highway: Eglinton Avenue West22 m
- transit stop: Eglinton Avenue West at Municipal Drive23 m
- retail: Elegant Spa & Studio33 m
- retail: Rose Discount Variety37 m
- parking lot41 m
- restaurant: Dimes Caribbean Restaurant41 m
- parking lot43 m
- restaurant: Wings Time45 m
- parking lot46 m
- highway: Eglinton Avenue West53 m
- retail: York Variety53 m
- parking lot53 m
- parking lot55 m
- retail: Captain's Barber Shop58 m
- parking lot60 m
- parking lot68 m
- parking lot79 m
- parking lot80 m
- highway: Eglinton Avenue West80 m
- rail: Line 5 Eglinton81 m
- rail: Line 5 Eglinton85 m
- parking lot85 m
- highway: Eglinton Avenue West89 m
- highway: Eglinton Avenue West94 m
- parking lot100 m
- transit stop: Trethewey Dr at Greentree Court103 m
- highway: Eglinton Avenue West108 m
- parking lot109 m
- highway: Black Creek Drive109 m
- restaurant: Triple-Triple Pizza & Chicken111 m
- highway: Eglinton Avenue West117 m
- retail: Fantashia Unisex Salon120 m
- highway: Eglinton Avenue West120 m
- transit stop: Trethewey Dr at Irving Rd122 m
- parking lot123 m
- transit stop: Clearview Heights126 m
- restaurant: Two Brothers Shawarma127 m
- highway: Eglinton Avenue West132 m
- highway: Black Creek Drive133 m
- highway: Eglinton Avenue West138 m
- highway: Eglinton Avenue West139 m
- highway: Black Creek Drive140 m
- highway: Eglinton Avenue West142 m
- transit stop: Trethewey Dr at Paulson Rd148 m
- transit stop: Keele Street148 m
- transit stop: Eglinton Avenue West152 m
- transit stop: Trethewey Dr at King Georges Dr155 m
- parking lot161 m
- highway: Eglinton Avenue West166 m
- transit stop: Paulson Road169 m
- parking lot178 m
- parking lot180 m
- transit stop: Keele St at Eglinton Ave W180 m
- transit stop: Keelesdale186 m
- transit stop: Keelesdale188 m
- parking lot188 m
- transit stop: Keelesdale Station189 m
- highway: Black Creek Drive189 m
- transit stop: Eglinton Ave. W. at Keele Street & Trethewey Drive190 m
- retail: Zac's Convenience192 m
- highway: Eglinton Avenue West194 m
- highway: Black Creek Drive196 m
- highway: Eglinton Avenue West198 m
Park profile
Five-axis radar across the structural dimensions.
Citywide percentile ranks
Across all Toronto parks in the dataset.
- Overall vitality66th
- Edge activation61th
- Connectivity93th
- Amenity diversity98th
- Natural comfort70th
- Enclosure68th
Most similar parks
Closest in metric space across the five structural dimensions.
- Cedarvale ParkRavine / Naturalized Park45
- Smythe ParkWaterfront Park44
- Amesbury ParkAthletic / Recreation Park41
- Tom Riley ParkWaterfront Park40
- Fairbank Memorial ParkCivic Square44
Most opposite parks
Furthest in metric space. Useful for recognising what kind of park this isn’t.
- Queen'S Quay Traffic IslandWaterfront Park49
- Simcoe ParkTower-Community Green Space51
- Manor Community GreenUrban Plaza57
- Joseph Burr Tyrrell ParkUrban Plaza50
- Bernard Avenue Road AllowanceUrban Plaza54
Human activity signals: not available
No activity signals have landed for this park yet. The model has scored its physical form but it can’t yet say how often it’s programmed, photographed, or walked through. See /data-ethics for what we will and will not collect.
Does this score feel accurate?
Your read of Coronation Park - Yorkmatters. We’re testing whether the model lines up with how people actually use the park. Submissions are stored locally; no account needed.
Tell us how this park feels
We measure structure (canopy, edges, connectivity). You measure feeling. Both matter, and disagreement is itself useful civic data.
What would improve this park?
Generated from the weakest measured dimensions: a starting point, not a prescription.
- Activate the edges: encourage cafés, retail or community uses on the streets that face the park; replace blank or parking-lot edges where possible.
- Diversify what people can do in the park (playground, washroom, water, shade, performance, sport, garden): even small additions raise this score.
- Mitigate border vacuums (highways, rail, parking) with active programming on the still-permeable edges and treat the hostile edge as a design challenge.
Data sources
- City of Toronto Open Data: Parks (Green Space)Polygon boundaries, official names, types.
- Parks & Recreation FacilitiesInventory of in-park amenities (washrooms, fields, rinks…).
- Toronto Pedestrian NetworkSidewalk segments around and through parks; estimated park entrances.
- Toronto Centreline V2Street segments + intersection nodes near park edges; trails and walkways.
- Toronto 3D MassingBuilding footprints + heights for edge-building counts, frontage density, and tower-in-the-park risk.
- Toronto Treed AreaTree canopy share inside park polygons via stratified-grid sampling.
- Toronto Waterbodies & RiversWater surface inside parks + nearest-water distance for cooling.
- Ravine & Natural Feature ProtectionRavine overlap as a cooling / natural-comfort signal.
- Toronto Street Tree InventoryTree count + density inside park polygons.
- Neighbourhood Profiles(Pending) Equity context proxy.
- OpenStreetMap (Overpass API)Cafés, restaurants, retail, transit stops, parking, highways, rail.