Dentonia Park Golf Course
Ravine / Naturalized Park, middle of the pack overall (score 31, rank ~34th percentile). Strongest: connectivity; weakest: edge activation.
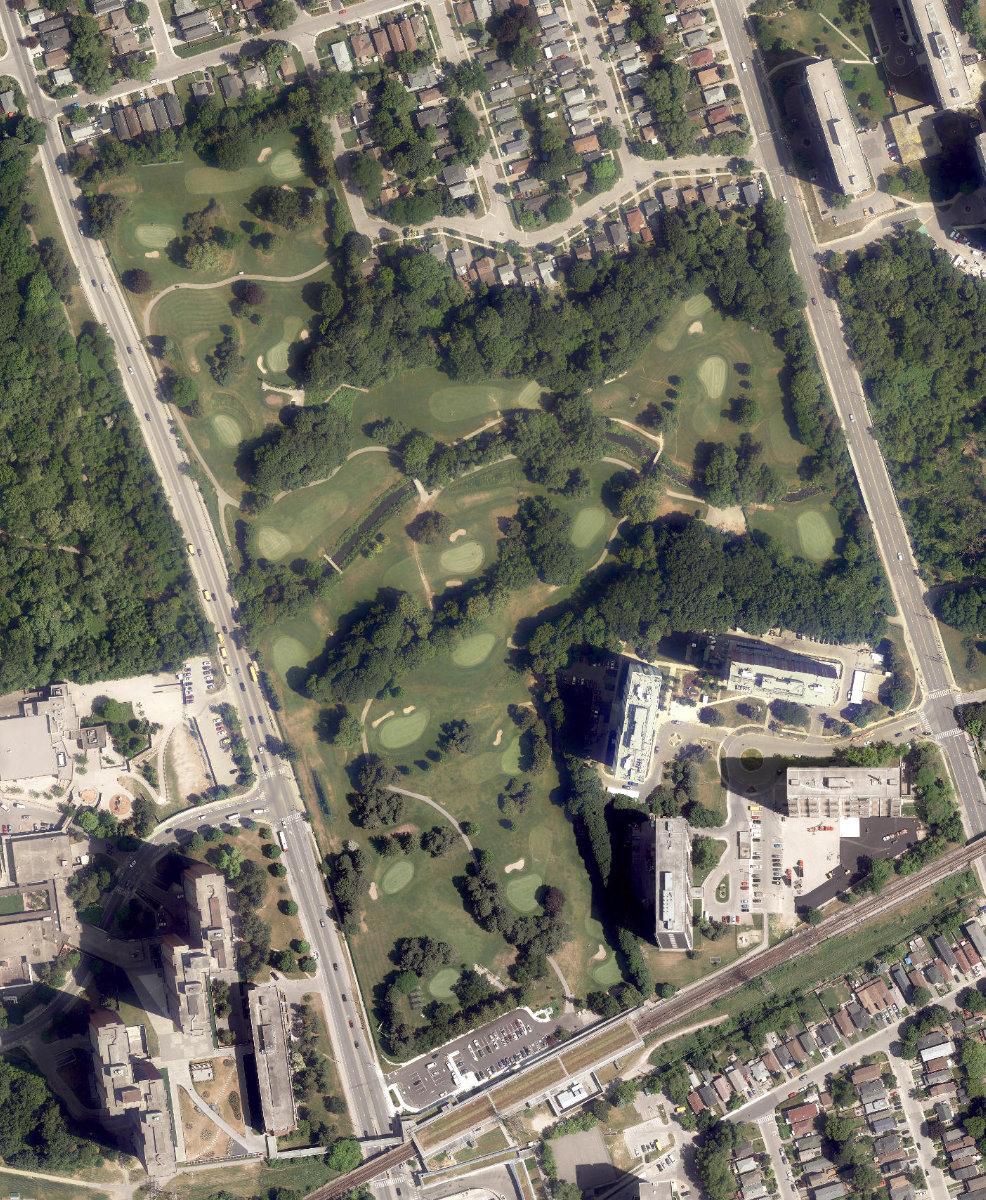
Aerial, City of Toronto orthophoto, ~8 cm/px source · cached 5/9/2026
Dentonia Park Golf Course scores 30.7 / 100. Strongest dimensions: enclosure / eyes on park and connectivity. Weakest: amenity diversity (0). Border-vacuum risk is elevated (96). This score is a transparent reading of Jane Jacobs-style vitality factors, not a definitive judgment.
Area · 14.31 ha
Weighted across six dimensions · confidence 63%
Scores are not bell-curved. Percentiles and expected scores provide context without changing the underlying model.
Loading map…
The parks map is loading.Explain this score
Where did the 31 come from? Each weighted contribution against a neutral 50 baseline. Green = pushed up; red = pulled down.
Sum of contributions = the headline score. A negative bar means that dimension dragged the park below the city-wide neutral baseline.
Why this park works
Dentonia Park Golf Course works because its connectivity score (68) is in the top tier and its natural comfort (62) is also top quartile (39 transit stops sit within a 400 m walk; 18 intersections fall within 100 m of the edge).
What limits this park
Dentonia Park Golf Course is held back by edge activation (0, below-average): the surrounding streets carry too few active uses to spill into the park; border-vacuum risk is also elevated (96).
Most distinctive characteristic
Most distinctive feature: exceptionally high connectivity (68, top quartile).
Jacobs reading
Dentonia Park Golf Course sits between an urban social park and an ecological retreat: moderately useful for both, exceptionally suited to neither.
Tradeoffs
- The park is enclosed by buildings (74) but the surrounding streets are quiet (edge activation 0): frame without animation.
- High connectivity coexists with high border-vacuum risk (96): much of that connectivity is to highways, rail, or parking lots, not to neighbourhoods.
Performance in context
- Reads as a modest underperformer relative to comparable parks (gap -5; cohort: large Ravine / Naturalized Park ravine).
Typology classification
Classified as Ravine / Naturalized Park: 100% ravine overlap, 12% canopy
Edge Activation
Within 100 m of the park edge: 21 active uses (transit_stop, retail) and 13 dead/hostile uses (parking_lot, rail). Active edges keep "eyes on the park" through the day; parking lots, blank institutional walls, rail and highway frontages drain street life.
Source: OSM POIs (amenity/shop) + Toronto Building Footprints + land use
Connectivity
Connectivity blends paths, intersections, transit, entrances, and edge density. This park has 4 mapped paths/walkways and 45 sidewalk segments within 50 m; 18 street intersections within 100 m; 39 transit stops within a 400 m walk; 0 estimated access points across ~2,037 m of perimeter. moderate edge density, small superblock penalty applied. Source coverage: centreline, pedestrian_network, transit_osm.
Source: Toronto Centreline V2 + Pedestrian Network + OSM transit stops
Amenity Diversity
No amenities recorded. Score is 0 until inventory is loaded.
Source: Toronto Parks & Recreation Facilities + OSM amenity tags
Natural Comfort
Natural-comfort components for this park: 11.8% estimated tree canopy; 100.0% inside the ravine system; nearest waterbody ~85 m; 4 city-mapped trees inside the polygon (0.3/ha). Reading: ravine-cooled. Source coverage: treed_area, ravine, waterbodies, street_trees. Impervious surface is approximated (Toronto's authoritative layer ships only as a raster GeoTIFF).
Source: Toronto Treed Area + Ravine + Waterbodies + Street Tree Inventory
Enclosure / Eyes on Park
117 buildings within 25 m of the park edge (7 mid-rise, 101 low-rise, 9 tower); avg edge height 10.6 m (~4 floors); 5.7 buildings per 100 m of 2,037 m perimeter (strong frontage density); edges are at a Jacobs-scale walkable mid-rise (3 to 7 floors); 9 towers ≥ 40 m within 25 m of the edge. "Eyes on the park" come strongest from the 7 mid-rise edge buildings.
Source: Toronto 3D Massing (building footprints + heights)
Border Vacuum Risk
Border-vacuum factors within 50 m of the park: parking_lot, parking_lot, Bloor-Danforth Line, Bloor-Danforth Line, Bloor-Danforth Line, Bloor-Danforth Line. Jacobs warned that highways, rail, parking lots and blank institutional edges act as "vacuums" that suppress foot traffic and isolate the park from its neighbourhood.
Source: Toronto Street Centreline (highways) + rail layer + OSM landuse + building footprints
Equity Context
Equity Context requires inputs not yet loaded for this park (Toronto Neighbourhood Profiles). Score is held at a neutral 50 with low confidence. Read with caution.
Source: Toronto Neighbourhood Profiles
Amenities (0)
No amenities recorded for this park.
Nearby active-edge features (49)
- transit stop: Crescent Town3 m
- parking lot7 m
- transit stop: North Walkway15 m
- transit stop: Teesdale Place Entrance19 m
- transit stop: Crescent Town25 m
- rail: Bloor-Danforth Line28 m
- transit stop: Teesdale Place29 m
- rail: Bloor-Danforth Line32 m
- transit stop: Victoria Park32 m
- transit stop: Victoria Park35 m
- rail: Bloor-Danforth Line38 m
- rail: Bloor-Danforth Line41 m
- parking lot42 m
- transit stop: Victoria Park Avenue44 m
- transit stop: Albion Avenue50 m
- parking lot52 m
- transit stop: Victoria Park Station56 m
- transit stop: Victoria Park Avenue59 m
- transit stop: Dolphin Drive62 m
- transit stop: Teesdale Place70 m
- transit stop73 m
- rail76 m
- rail76 m
- transit stop: Dolphin Drive78 m
- transit stop: Victoria Park Station80 m
- transit stop: Crescent Town Bridge81 m
- parking lot84 m
- parking lot85 m
- parking lot: Toronto Transit Commission - East Lot88 m
- parking lot89 m
- retail: Mona's Unique Hairstyle93 m
- transit stop: Medhurst Road93 m
- retail: L&L Convenience94 m
- transit stop: Victoria Park Station98 m
- transit stop: Massey Square (East)105 m
- parking lot106 m
- rail: Bloor-Danforth Line110 m
- rail: Bloor-Danforth Line111 m
- parking lot112 m
- parking lot117 m
- transit stop: Victoria Park Station120 m
- rail: Bloor-Danforth Line128 m
- rail: Bloor-Danforth Line133 m
- transit stop: Victoria Park Station137 m
- transit stop151 m
- parking lot165 m
- parking lot167 m
- transit stop: Conroy Avenue176 m
- transit stop: Albion Avenue197 m
Park profile
Five-axis radar across the structural dimensions.
Citywide percentile ranks
Across all Toronto parks in the dataset.
- Overall vitality34th
- Edge activation34th
- Connectivity88th
- Amenity diversity41th
- Natural comfort76th
- Enclosure74th
Most similar parks
Closest in metric space across the five structural dimensions.
- City Wide Open SpaceCorridor / Linear Park30
- Charles Sauriol ParketteRavine / Naturalized Park36
- Scarborough Hydro Green SpaceRavine / Naturalized Park30
- Yorkdale ParkParkette37
- Bayview - York Mills ParketteRavine / Naturalized Park37
Most opposite parks
Furthest in metric space. Useful for recognising what kind of park this isn’t.
- Leslie Grove ParkParkette68
- Joseph Burr Tyrrell ParkUrban Plaza50
- Queen'S Quay Traffic IslandWaterfront Park49
- Simcoe ParkTower-Community Green Space51
- Kew GardensNeighbourhood Park71
Human activity signals: not available
No activity signals have landed for this park yet. The model has scored its physical form but it can’t yet say how often it’s programmed, photographed, or walked through. See /data-ethics for what we will and will not collect.
Does this score feel accurate?
Your read of Dentonia Park Golf Coursematters. We’re testing whether the model lines up with how people actually use the park. Submissions are stored locally; no account needed.
Tell us how this park feels
We measure structure (canopy, edges, connectivity). You measure feeling. Both matter, and disagreement is itself useful civic data.
What would improve this park?
Generated from the weakest measured dimensions: a starting point, not a prescription.
- Activate the edges: encourage cafés, retail or community uses on the streets that face the park; replace blank or parking-lot edges where possible.
- Diversify what people can do in the park (playground, washroom, water, shade, performance, sport, garden): even small additions raise this score.
- Mitigate border vacuums (highways, rail, parking) with active programming on the still-permeable edges and treat the hostile edge as a design challenge.
Data sources
- City of Toronto Open Data: Parks (Green Space)Polygon boundaries, official names, types.
- Parks & Recreation FacilitiesInventory of in-park amenities (washrooms, fields, rinks…).
- Toronto Pedestrian NetworkSidewalk segments around and through parks; estimated park entrances.
- Toronto Centreline V2Street segments + intersection nodes near park edges; trails and walkways.
- Toronto 3D MassingBuilding footprints + heights for edge-building counts, frontage density, and tower-in-the-park risk.
- Toronto Treed AreaTree canopy share inside park polygons via stratified-grid sampling.
- Toronto Waterbodies & RiversWater surface inside parks + nearest-water distance for cooling.
- Ravine & Natural Feature ProtectionRavine overlap as a cooling / natural-comfort signal.
- Toronto Street Tree InventoryTree count + density inside park polygons.
- Neighbourhood Profiles(Pending) Equity context proxy.
- OpenStreetMap (Overpass API)Cafés, restaurants, retail, transit stops, parking, highways, rail.