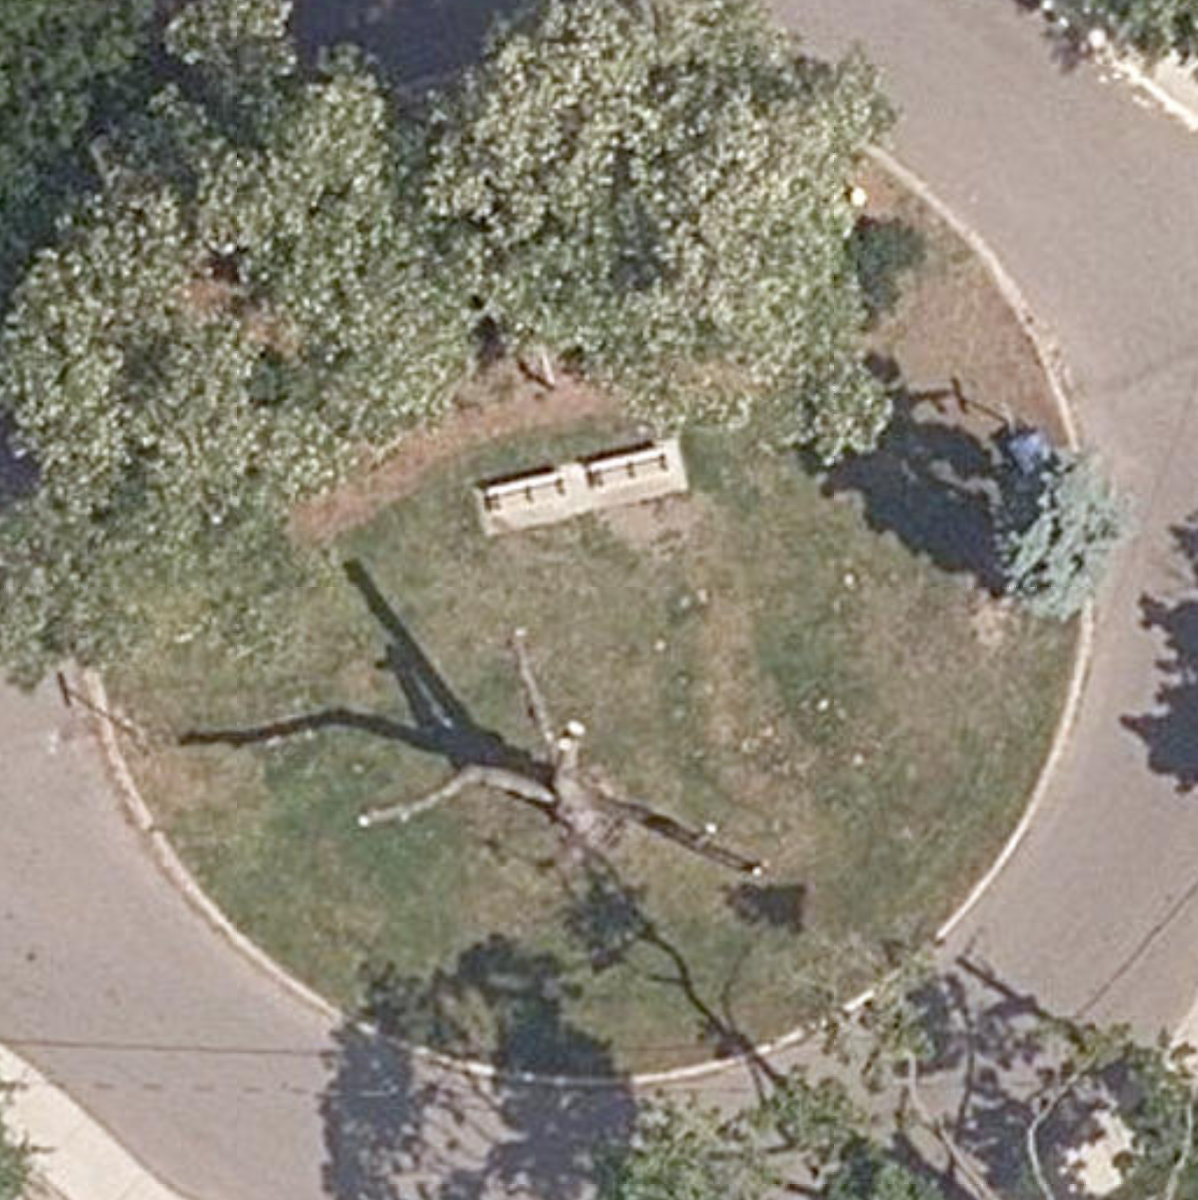
Indian Mound Traffic Island
Waterfront Park, middle of the pack overall (score 33, rank ~47th percentile). Strongest: enclosure; weakest: natural comfort.
Aerial, City of Toronto orthophoto, ~8 cm/px source · cached 5/9/2026
Indian Mound Traffic Island scores 33.4 / 100. Strongest dimensions: enclosure / eyes on park and connectivity. Weakest: amenity diversity (0). Border-vacuum risk is low. This score is a transparent reading of Jane Jacobs-style vitality factors, not a definitive judgment.
Area · 0.04 ha
Weighted across six dimensions · confidence 57%
Scores are not bell-curved. Percentiles and expected scores provide context without changing the underlying model.
Loading map…
The parks map is loading.Explain this score
Where did the 33 come from? Each weighted contribution against a neutral 50 baseline. Green = pushed up; red = pulled down.
Sum of contributions = the headline score. A negative bar means that dimension dragged the park below the city-wide neutral baseline.
Why this park works
Indian Mound Traffic Island works because its enclosure score (90) is one of the city's strongest and its amenity diversity (0) is also above-average (15 mid-rise buildings frame the edge with passive surveillance).
What limits this park
Indian Mound Traffic Island is held back by natural comfort (39, below-average): only 0% canopy means little summer shade.
Most distinctive characteristic
Most distinctive feature: exceptionally high enclosure (90, top decile).
Jacobs reading
Indian Mound Traffic Island sits between an urban social park and an ecological retreat: moderately useful for both, exceptionally suited to neither.
Tradeoffs
- The park is enclosed by buildings (90) but the surrounding streets are quiet (edge activation 0): frame without animation.
Typology classification
Classified as Waterfront Park: name suggests waterfront and nearest waterbody is ~257 m away. Secondary read: Urban Plaza (419 m², paved (0% canopy), 52.0 buildings/100 m).
Edge Activation
Within 100 m of the park edge: 0 active uses (none) and 0 dead/hostile uses (none). Active edges keep "eyes on the park" through the day; parking lots, blank institutional walls, rail and highway frontages drain street life.
Source: OSM POIs (amenity/shop) + Toronto Building Footprints + land use
Connectivity
Connectivity blends paths, intersections, transit, entrances, and edge density. This park has 0 mapped paths/walkways and 3 sidewalk segments within 50 m; 7 street intersections within 100 m; 16 transit stops within a 400 m walk; 0 estimated access points across ~73 m of perimeter. edge density is healthy, no superblock penalty. Source coverage: centreline, pedestrian_network, transit_osm.
Source: Toronto Centreline V2 + Pedestrian Network + OSM transit stops
Amenity Diversity
No amenities recorded. Score is 0 until inventory is loaded.
Source: Toronto Parks & Recreation Facilities + OSM amenity tags
Natural Comfort
Natural-comfort components for this park: ~3.5% effective canopy (0.0% from contiguous tree polygons + scattered tree density); nearest waterbody ~257 m; 5 city-mapped trees inside the polygon (5.0/ha). Reading: exposed. Source coverage: waterbodies, street_trees. Impervious surface is approximated (Toronto's authoritative layer ships only as a raster GeoTIFF).
Source: Toronto Treed Area + Ravine + Waterbodies + Street Tree Inventory
Enclosure / Eyes on Park
52 buildings within 25 m of the park edge (15 mid-rise, 37 low-rise, 0 tower); avg edge height 8.2 m (~3 floors); 52.0 buildings per 100 m of 73 m perimeter (strong frontage density); edges are low-rise (mostly 2 to 3 floors); no towers immediately adjacent. "Eyes on the park" come strongest from the 15 mid-rise edge buildings.
Source: Toronto 3D Massing (building footprints + heights)
Border Vacuum Risk
Park edges face the city. No significant border vacuum detected.
Source: Toronto Street Centreline (highways) + rail layer + OSM landuse + building footprints
Equity Context
Equity Context requires inputs not yet loaded for this park (Toronto Neighbourhood Profiles). Score is held at a neutral 50 with low confidence. Read with caution.
Source: Toronto Neighbourhood Profiles
Amenities (0)
No amenities recorded for this park.
Nearby active-edge features (37)
- parking lot114 m
- highway: Bloor Street West131 m
- restaurant: Pho T&T Express138 m
- highway: Bloor Street West139 m
- restaurant: High Low Pub141 m
- restaurant: The Wicket144 m
- cafe: Cabin Fever Collective147 m
- highway: Bloor Street West148 m
- highway: Bloor Street West150 m
- retail: MultiCare Pharmacy153 m
- restaurant: Whelan's Gate155 m
- restaurant: Dynamite Sushi159 m
- parking lot162 m
- cafe: Cosette164 m
- transit stop166 m
- highway: Bloor Street West168 m
- cafe: Caked Coffee169 m
- restaurant: Subway169 m
- highway: Bloor Street West172 m
- retail: PLUG Cannabis173 m
- restaurant: Dairy Queen175 m
- retail: Yan Tattoo & Piercing176 m
- retail: Benito's Tacos177 m
- retail: 7-Eleven180 m
- restaurant: Pizza Pizza180 m
- parking lot180 m
- retail: Vintage Iron181 m
- retail: Hawaii Nails & Spa183 m
- retail: Game Mania184 m
- retail: First Choice Haircutters186 m
- restaurant: The Mugshot Tavern188 m
- restaurant: Pizzaville192 m
- parking lot193 m
- restaurant: Lunch Box194 m
- cafe: Ichi Cha Bubble Tea194 m
- restaurant: Sushi Place197 m
- restaurant: Wings Up!198 m
Park profile
Five-axis radar across the structural dimensions.
Citywide percentile ranks
Across all Toronto parks in the dataset.
- Overall vitality47th
- Edge activation57th
- Connectivity41th
- Amenity diversity65th
- Natural comfort34th
- Enclosure96th
Most similar parks
Closest in metric space across the five structural dimensions.
- St. Stevens Court ParketteUrban Plaza33
- Stewart A. Mcgregor ParketteUrban Plaza33
- Massey Creek RavineWaterfront Park25
- Oak Street ParketteUrban Plaza33
- Chestnut Park Traffic IslandUrban Plaza32
Most opposite parks
Furthest in metric space. Useful for recognising what kind of park this isn’t.
- Kew GardensNeighbourhood Park71
- Leslie Grove ParkParkette68
- Toronto Islands - Island ParkWaterfront Park52
- Toronto ZooWaterfront Park57
- Mclevin Woods ParkRavine / Naturalized Park49
Human activity signals: not available
No activity signals have landed for this park yet. The model has scored its physical form but it can’t yet say how often it’s programmed, photographed, or walked through. See /data-ethics for what we will and will not collect.
Does this score feel accurate?
Your read of Indian Mound Traffic Islandmatters. We’re testing whether the model lines up with how people actually use the park. Submissions are stored locally; no account needed.
Tell us how this park feels
We measure structure (canopy, edges, connectivity). You measure feeling. Both matter, and disagreement is itself useful civic data.
What would improve this park?
Generated from the weakest measured dimensions: a starting point, not a prescription.
- Activate the edges: encourage cafés, retail or community uses on the streets that face the park; replace blank or parking-lot edges where possible.
- Add or open more entrances and improve sidewalk continuity around the park. More permeability means more spontaneous use.
- Diversify what people can do in the park (playground, washroom, water, shade, performance, sport, garden): even small additions raise this score.
- Increase canopy and reduce paved area. Shade and water features extend usable hours and seasons.
Data sources
- City of Toronto Open Data: Parks (Green Space)Polygon boundaries, official names, types.
- Parks & Recreation FacilitiesInventory of in-park amenities (washrooms, fields, rinks…).
- Toronto Pedestrian NetworkSidewalk segments around and through parks; estimated park entrances.
- Toronto Centreline V2Street segments + intersection nodes near park edges; trails and walkways.
- Toronto 3D MassingBuilding footprints + heights for edge-building counts, frontage density, and tower-in-the-park risk.
- Toronto Treed AreaTree canopy share inside park polygons via stratified-grid sampling.
- Toronto Waterbodies & RiversWater surface inside parks + nearest-water distance for cooling.
- Ravine & Natural Feature ProtectionRavine overlap as a cooling / natural-comfort signal.
- Toronto Street Tree InventoryTree count + density inside park polygons.
- Neighbourhood Profiles(Pending) Equity context proxy.
- OpenStreetMap (Overpass API)Cafés, restaurants, retail, transit stops, parking, highways, rail.