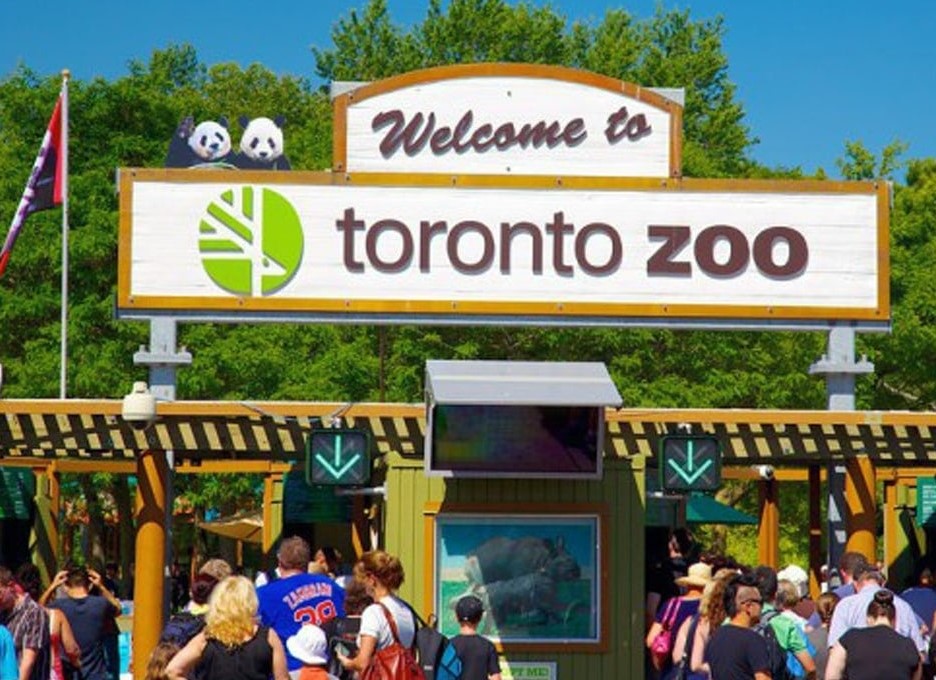
Toronto Zoo
Waterfront Park, one of the city's strongest overall (score 57, rank ~99th percentile). Strongest: edge activation; weakest: enclosure.
Photo by Elizabeth B via Google Places · cached 5/9/2026
Toronto Zoo scores 57.3 / 100. Strongest dimensions: natural comfort and edge activation. Weakest: amenity diversity (0). Border-vacuum risk is low. This score is a transparent reading of Jane Jacobs-style vitality factors, not a definitive judgment.
Area · 206.20 ha
Weighted across six dimensions · confidence 63%
Scores are not bell-curved. Percentiles and expected scores provide context without changing the underlying model.
Loading map…
The parks map is loading.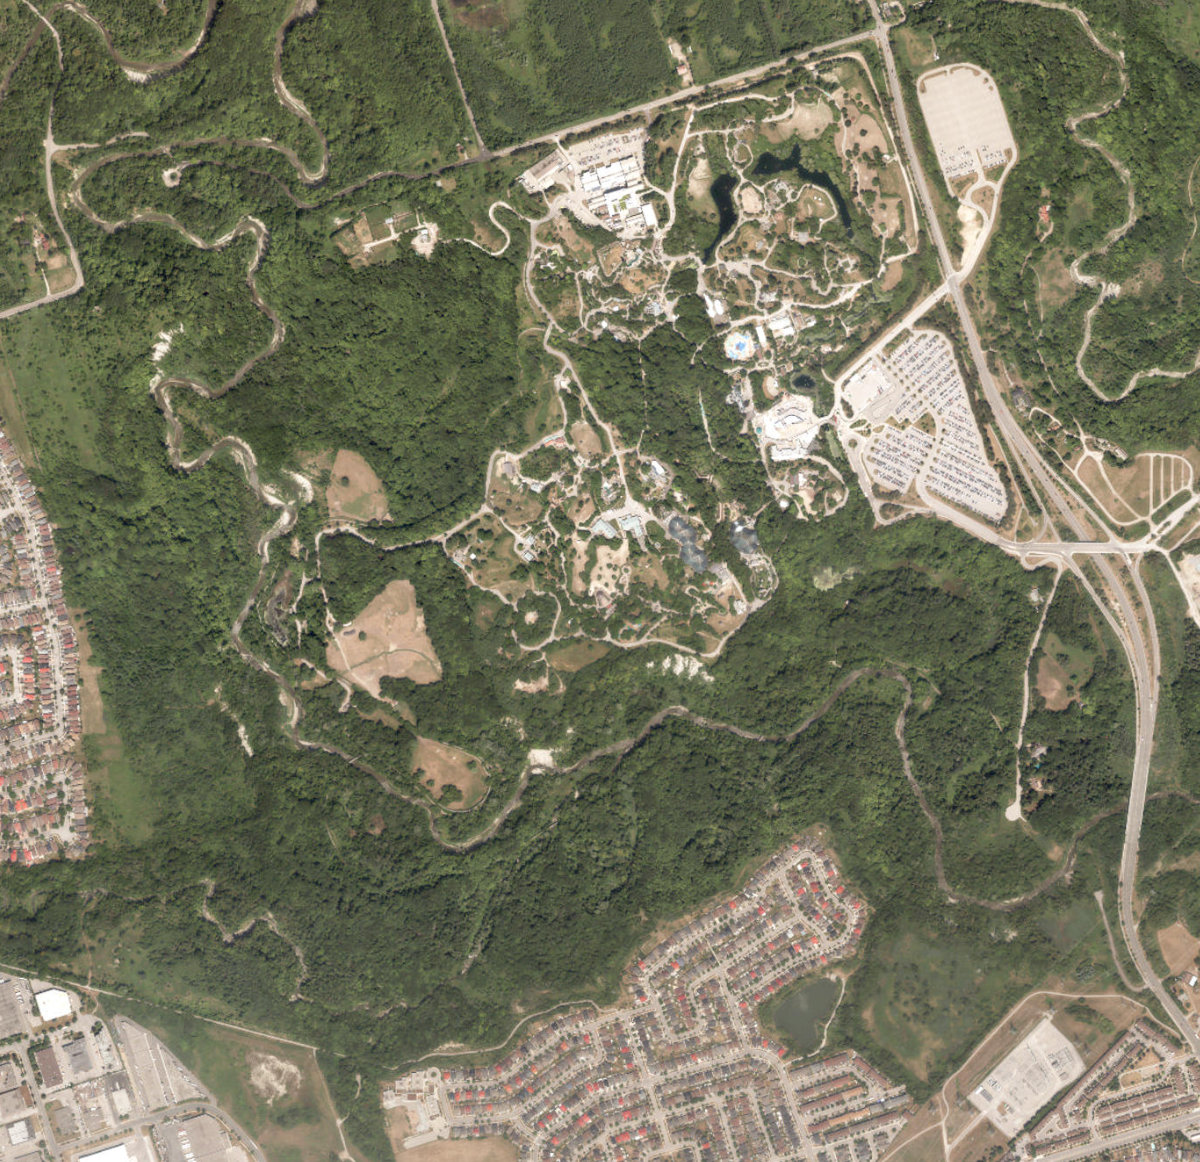
Explain this score
Where did the 57 come from? Each weighted contribution against a neutral 50 baseline. Green = pushed up; red = pulled down.
Sum of contributions = the headline score. A negative bar means that dimension dragged the park below the city-wide neutral baseline.
Why this park works
Toronto Zoo works because its edge activation score (76) is one of the city's strongest and its natural comfort (84) is also top decile (its perimeter is lined with active uses).
What limits this park
Toronto Zoo is held back by enclosure (54, bottom quartile).
Most distinctive characteristic
Most distinctive feature: exceptionally high edge activation (76, top decile).
Jacobs reading
Toronto Zoo sits between an urban social park and an ecological retreat: moderately useful for both, exceptionally suited to neither.
Tradeoffs
- Natural comfort (84) significantly outpaces connectivity (58): restorative but hard to reach for daily use.
Performance in context
- This park is a strong overperformer for its cohort: raw 57 versus an expected 35 for similar parks (very large Waterfront Park waterfront) (gap +23).
Typology classification
Classified as Waterfront Park: 6% water surface inside park. Secondary read: Ravine / Naturalized Park (100% ravine overlap, 80% canopy).
Edge Activation
Within 100 m of the park edge: 31 active uses (transit_stop, cafe, restaurant, retail) and 1 dead/hostile uses (parking_lot). Active edges keep "eyes on the park" through the day; parking lots, blank institutional walls, rail and highway frontages drain street life.
Source: OSM POIs (amenity/shop) + Toronto Building Footprints + land use
Connectivity
Connectivity blends paths, intersections, transit, entrances, and edge density. This park has 4 mapped paths/walkways and 30 sidewalk segments within 50 m; 16 street intersections within 100 m; 26 transit stops within a 400 m walk; 0 estimated access points across ~7,045 m of perimeter. low edge density, significant superblock penalty applied. Source coverage: centreline, pedestrian_network, transit_osm.
Source: Toronto Centreline V2 + Pedestrian Network + OSM transit stops
Amenity Diversity
No amenities recorded. Score is 0 until inventory is loaded.
Source: Toronto Parks & Recreation Facilities + OSM amenity tags
Natural Comfort
Natural-comfort components for this park: 79.8% estimated tree canopy; 99.6% inside the ravine system; 6.2% water surface; 54 city-mapped trees inside the polygon (0.3/ha). Reading: ravine-cooled. Source coverage: treed_area, ravine, waterbodies, street_trees. Impervious surface is approximated (Toronto's authoritative layer ships only as a raster GeoTIFF).
Source: Toronto Treed Area + Ravine + Waterbodies + Street Tree Inventory
Enclosure / Eyes on Park
266 buildings within 25 m of the park edge (1 mid-rise, 265 low-rise, 0 tower); avg edge height 5.2 m (~2 floors); 3.8 buildings per 100 m of 7,045 m perimeter (strong frontage density); edges are barely there or single-storey; no towers immediately adjacent. "Eyes on the park" come strongest from the 1 mid-rise edge buildings.
Source: Toronto 3D Massing (building footprints + heights)
Border Vacuum Risk
Border-vacuum factors within 50 m of the park: Employees only. Jacobs warned that highways, rail, parking lots and blank institutional edges act as "vacuums" that suppress foot traffic and isolate the park from its neighbourhood.
Source: Toronto Street Centreline (highways) + rail layer + OSM landuse + building footprints
Equity Context
Equity Context requires inputs not yet loaded for this park (Toronto Neighbourhood Profiles). Score is held at a neutral 50 with low confidence. Read with caution.
Source: Toronto Neighbourhood Profiles
Amenities (0)
No amenities recorded for this park.
Nearby active-edge features (34)
- transit stop: Canadian Domain Station0 m
- transit stop: Main Station0 m
- cafe: Peacock Cafe0 m
- restaurant: Smokes Poutinerie0 m
- restaurant: Dairy Queen0 m
- restaurant: Pizza Pizza0 m
- restaurant: Simba Safari Lodge - LLBO0 m
- restaurant: Thorntree Snack Bar0 m
- restaurant: Hola Churros0 m
- cafe: Tim Hortons0 m
- cafe: Palgong Tea0 m
- cafe: Palgong Tea0 m
- restaurant: Maridadi duka0 m
- retail: Twiga Market0 m
- transit stop: Africa Station0 m
- restaurant: Beavertails0 m
- restaurant: Smoke's Poutinerie0 m
- restaurant: Tim Hortons Express0 m
- restaurant: Beavertails0 m
- cafe: Palgong Tea0 m
- restaurant: Pizza Pizza0 m
- restaurant: Savanna Snack Bar0 m
- transit stop: Tundra Station0 m
- retail: The Eurasia Wilds Outpost0 m
- parking lot: Employees only0 m
- transit stop: Toronto Zoo80 m
- transit stop: Zoo Road EB @ Meadowvale (Rouge Park Visitor Cente)82 m
- transit stop: Toronto Zoo82 m
- transit stop: Park Rd at Kirkhams Rd84 m
- transit stop: Toronto Zoo85 m
- transit stop: Toronto Zoo98 m
- transit stop: Toronto Zoo98 m
- parking lot160 m
- transit stop: Eurasia Station161 m
Park profile
Five-axis radar across the structural dimensions.
Citywide percentile ranks
Across all Toronto parks in the dataset.
- Overall vitality99th
- Edge activation99th
- Connectivity71th
- Amenity diversity58th
- Natural comfort95th
- Enclosure19th
Most similar parks
Closest in metric space across the five structural dimensions.
- Trca Lands ( 81)Waterfront Park52
- Rouge ParkRavine / Naturalized Park53
- City Wide Open SpaceCorridor / Linear Park50
- Douglas B. Ford ParkRavine / Naturalized Park55
- City Wide Open SpaceCorridor / Linear Park51
Most opposite parks
Furthest in metric space. Useful for recognising what kind of park this isn’t.
- Rouge ParkRavine / Naturalized Park18
- Trca Lands ( 58)Waterfront Park18
- City Wide Open SpaceUrban Plaza23
- Erica Stark ParketteUrban Plaza30
- Etobicoke Hydro Green SpaceOther20
Visitor signals
Public attention measured by Google Places aggregates. This proxies attention, not occupancy. Aggregate-only: no usernames, no review text, no extra photos beyond the cached hero.
“Immense zoo with outdoor pavilions housing hundreds of species, plus a large botanical collection.” (Google editorial summary)
p97 citywide · p97 within Waterfront Park
Source: Google Places API · match unverified (0.00 composite confidence) · last refreshed 5/9/2026. Privacy contract. Measures public attention, not occupancy.
Human activity signals: not available
No activity signals have landed for this park yet. The model has scored its physical form but it can’t yet say how often it’s programmed, photographed, or walked through. See /data-ethics for what we will and will not collect.
Does this score feel accurate?
Your read of Toronto Zoomatters. We’re testing whether the model lines up with how people actually use the park. Submissions are stored locally; no account needed.
Tell us how this park feels
We measure structure (canopy, edges, connectivity). You measure feeling. Both matter, and disagreement is itself useful civic data.
What would improve this park?
Generated from the weakest measured dimensions: a starting point, not a prescription.
- Diversify what people can do in the park (playground, washroom, water, shade, performance, sport, garden): even small additions raise this score.
Data sources
- City of Toronto Open Data: Parks (Green Space)Polygon boundaries, official names, types.
- Parks & Recreation FacilitiesInventory of in-park amenities (washrooms, fields, rinks…).
- Toronto Pedestrian NetworkSidewalk segments around and through parks; estimated park entrances.
- Toronto Centreline V2Street segments + intersection nodes near park edges; trails and walkways.
- Toronto 3D MassingBuilding footprints + heights for edge-building counts, frontage density, and tower-in-the-park risk.
- Toronto Treed AreaTree canopy share inside park polygons via stratified-grid sampling.
- Toronto Waterbodies & RiversWater surface inside parks + nearest-water distance for cooling.
- Ravine & Natural Feature ProtectionRavine overlap as a cooling / natural-comfort signal.
- Toronto Street Tree InventoryTree count + density inside park polygons.
- Neighbourhood Profiles(Pending) Equity context proxy.
- OpenStreetMap (Overpass API)Cafés, restaurants, retail, transit stops, parking, highways, rail.