Etobicoke Hydro Green Space
Corridor / Linear Park, near the bottom of the city overall (score 17, rank ~1th percentile). Strongest: edge activation; weakest: enclosure.
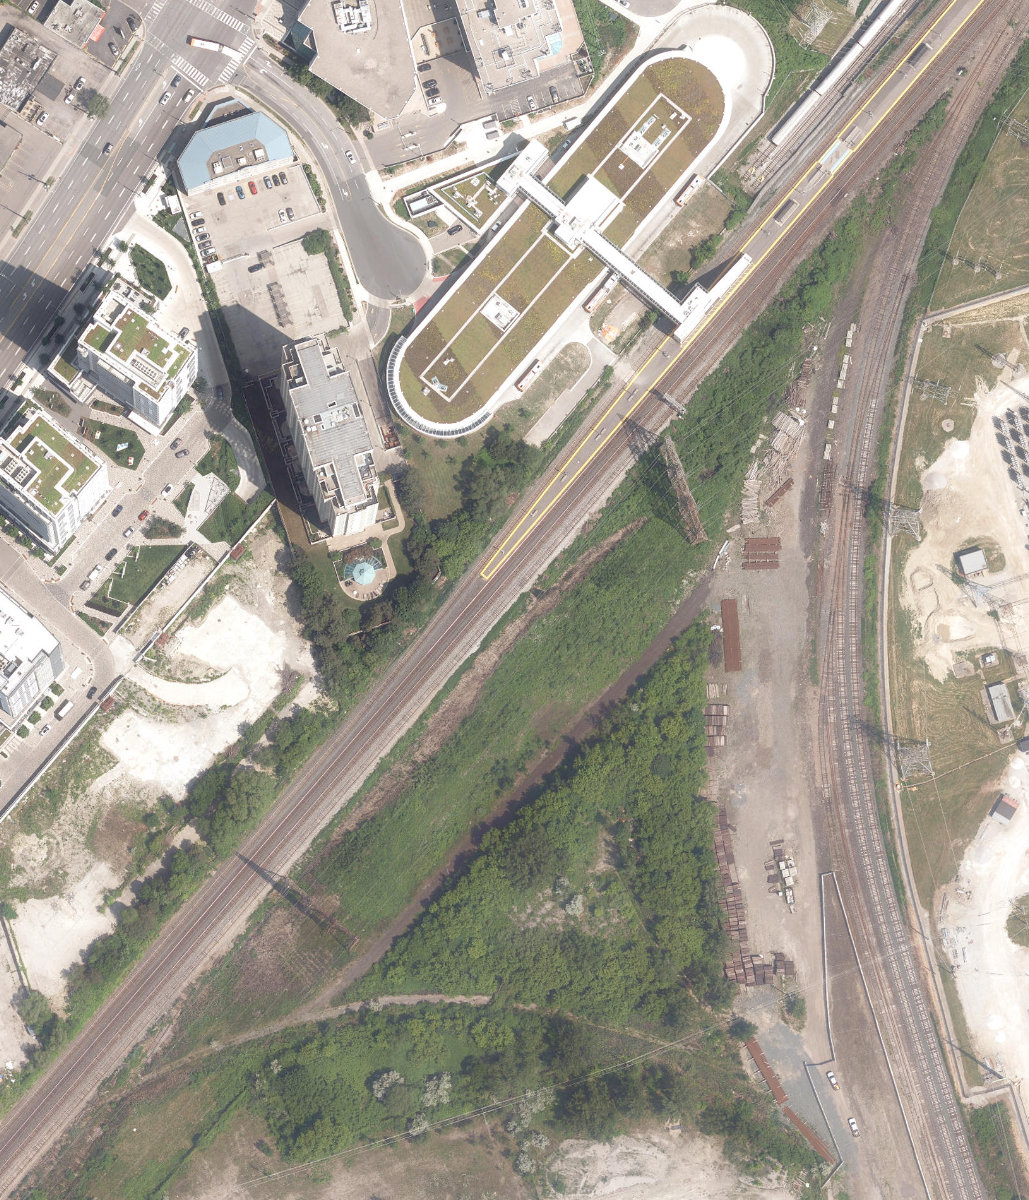
Aerial, City of Toronto orthophoto, ~8 cm/px source · cached 5/9/2026
Etobicoke Hydro Green Space scores 17.1 / 100. Strongest dimensions: connectivity and natural comfort. Weakest: amenity diversity (0). Border-vacuum risk is elevated (72). This score is a transparent reading of Jane Jacobs-style vitality factors, not a definitive judgment.
Area · 1.16 ha
Weighted across six dimensions · confidence 56%
Scores are not bell-curved. Percentiles and expected scores provide context without changing the underlying model.
Loading map…
The parks map is loading.Explain this score
Where did the 17 come from? Each weighted contribution against a neutral 50 baseline. Green = pushed up; red = pulled down.
Sum of contributions = the headline score. A negative bar means that dimension dragged the park below the city-wide neutral baseline.
Why this park works
Etobicoke Hydro Green Space works because its edge activation score (12) is above average.
What limits this park
Etobicoke Hydro Green Space is held back by enclosure (21, bottom quartile); border-vacuum risk is also elevated (72).
Most distinctive characteristic
Most distinctive feature: exceptionally low enclosure (21, bottom quartile).
Jacobs reading
Etobicoke Hydro Green Space is currently underperforming on both axes: neither integrated into the city nor offering deep natural respite. A candidate for design intervention.
Tradeoffs
- 6 nearby towers cast wind and shadow without contributing canopy: passive surveillance is plentiful but human-scale comfort is not.
Performance in context
- Strong underperformer relative to its cohort: raw 17 vs an expected 37 (gap -20).
Typology classification
Classified as Corridor / Linear Park: shape elongation 2.4× a circle of equal area. Secondary read: Tower-Community Green Space (6 towers vs 1 mid-rise within 25 m on a 1.2 ha park).
Edge Activation
Within 100 m of the park edge: 19 active uses (transit_stop, cafe) and 8 dead/hostile uses (rail). Active edges keep "eyes on the park" through the day; parking lots, blank institutional walls, rail and highway frontages drain street life.
Source: OSM POIs (amenity/shop) + Toronto Building Footprints + land use
Connectivity
Connectivity blends paths, intersections, transit, entrances, and edge density. This park has 0 mapped paths/walkways and 2 sidewalk segments within 50 m; 2 street intersections within 100 m; 59 transit stops within a 400 m walk; 0 estimated access points across ~914 m of perimeter. low edge density, significant superblock penalty applied. Source coverage: centreline, pedestrian_network, transit_osm.
Source: Toronto Centreline V2 + Pedestrian Network + OSM transit stops
Amenity Diversity
No amenities recorded. Score is 0 until inventory is loaded.
Source: Toronto Parks & Recreation Facilities + OSM amenity tags
Natural Comfort
Natural-comfort components for this park: 0.0% estimated tree canopy; nearest waterbody ~974 m. Reading: exposed. Source coverage: waterbodies. Impervious surface is approximated (Toronto's authoritative layer ships only as a raster GeoTIFF).
Source: Toronto Treed Area + Ravine + Waterbodies + Street Tree Inventory
Enclosure / Eyes on Park
9 buildings within 25 m of the park edge (1 mid-rise, 2 low-rise, 6 tower); avg edge height 47.1 m (~16 floors); 1.0 buildings per 100 m of 914 m perimeter (thin frontage with significant blank-edge share); edges dominated by towers; 6 towers ≥ 40 m within 25 m of the edge. "Eyes on the park" come strongest from the 1 mid-rise edge buildings.
Source: Toronto 3D Massing (building footprints + heights)
Border Vacuum Risk
Border-vacuum factors within 50 m of the park: rail, Galt Subdivision, rail, Bloor-Danforth Line. Jacobs warned that highways, rail, parking lots and blank institutional edges act as "vacuums" that suppress foot traffic and isolate the park from its neighbourhood.
Source: Toronto Street Centreline (highways) + rail layer + OSM landuse + building footprints
Equity Context
Equity Context requires inputs not yet loaded for this park (Toronto Neighbourhood Profiles). Score is held at a neutral 50 with low confidence. Read with caution.
Source: Toronto Neighbourhood Profiles
Amenities (0)
No amenities recorded for this park.
Nearby active-edge features (63)
- rail5 m
- rail: Galt Subdivision7 m
- transit stop: Kipling11 m
- transit stop: Kipling17 m
- rail30 m
- rail: Bloor-Danforth Line48 m
- rail: Bloor-Danforth Line54 m
- transit stop: Kipling Bus Terminal Platform 1555 m
- transit stop: Kipling Bus Terminal Platform 1455 m
- transit stop: Kipling Bus Terminal Platform 1355 m
- transit stop: Kipling Bus Terminal Platform 955 m
- transit stop: Kipling Bus Terminal Platform 1055 m
- transit stop: Kipling Bus Terminal Platform 1155 m
- transit stop: Kipling Bus Terminal Platform 1255 m
- rail56 m
- rail: Canpa Subdivision63 m
- cafe: Second Cup67 m
- transit stop: Kipling Bus Terminal Platform 1680 m
- transit stop: Kipling Bus Terminal Platform 882 m
- transit stop: Kipling Bus Terminal Platform 782 m
- transit stop: Kipling Bus Terminal Platform 682 m
- transit stop: Kipling Bus Terminal Platform 582 m
- transit stop: Kipling Bus Terminal Platform 482 m
- transit stop: Kipling Bus Terminal Platform 382 m
- rail82 m
- transit stop: Kipling83 m
- transit stop: Kipling87 m
- parking lot108 m
- parking lot127 m
- parking lot133 m
- rail: Galt Subdivision135 m
- retail: Diamonds Beauty Club135 m
- transit stop: Kipling139 m
- transit stop: Kipling142 m
- retail143 m
- transit stop: Kipling Station145 m
- parking lot150 m
- restaurant: Shawarma Royale150 m
- retail151 m
- parking lot153 m
- transit stop: Kipling Station North Parking Lot154 m
- parking lot156 m
- cafe: Gong Cha157 m
- transit stop: Kipling Station158 m
- retail: Money Mart161 m
- restaurant: Blooming Batter161 m
- parking lot169 m
- transit stop171 m
- transit stop: Dundas Street At Wilmar Road171 m
- restaurant: Dairy Queen171 m
- transit stop: Kipling Station174 m
- transit stop: Dundas Street at Wilmar Road176 m
- transit stop: Dundas Street at Wilmar Road177 m
- retail: Best for Bride184 m
- parking lot187 m
- cafe: Java Joe's188 m
- highway: Dundas Street West188 m
- parking lot: TTC Parking - Kipling South Lot191 m
- transit stop: Dundas Street At Subway Crescent191 m
- transit stop: Subway Crescent191 m
- highway: Dundas Street West196 m
- rail: Galt Subdivision197 m
- transit stop: Kipling Station197 m
Park profile
Five-axis radar across the structural dimensions.
Citywide percentile ranks
Across all Toronto parks in the dataset.
- Overall vitality1th
- Edge activation71th
- Connectivity17th
- Amenity diversity31th
- Natural comfort3th
- Enclosure1th
Most similar parks
Closest in metric space across the five structural dimensions.
- Woodbine Beach ParkWaterfront Park25
- Leslie Street Allotment GardensOther26
- City Wide Open SpaceOther13
- Toronto ZooRavine / Naturalized Park23
- Rouge ParkRavine / Naturalized Park20
Most opposite parks
Furthest in metric space. Useful for recognising what kind of park this isn’t.
- Kew GardensNeighbourhood Park71
- Leslie Grove ParkParkette68
- Sir Winston Churchill ParkRavine / Naturalized Park69
- High ParkRavine / Naturalized Park47
- Market Lane ParkUrban Plaza63
Human activity signals: not available
No activity signals have landed for this park yet. The model has scored its physical form but it can’t yet say how often it’s programmed, photographed, or walked through. See /data-ethics for what we will and will not collect.
Does this score feel accurate?
Your read of Etobicoke Hydro Green Spacematters. We’re testing whether the model lines up with how people actually use the park. Submissions are stored locally; no account needed.
Tell us how this park feels
We measure structure (canopy, edges, connectivity). You measure feeling. Both matter, and disagreement is itself useful civic data.
What would improve this park?
Generated from the weakest measured dimensions: a starting point, not a prescription.
- Activate the edges: encourage cafés, retail or community uses on the streets that face the park; replace blank or parking-lot edges where possible.
- Add or open more entrances and improve sidewalk continuity around the park. More permeability means more spontaneous use.
- Diversify what people can do in the park (playground, washroom, water, shade, performance, sport, garden): even small additions raise this score.
- Increase canopy and reduce paved area. Shade and water features extend usable hours and seasons.
- Encourage mid-rise, windowed frontages around the park so residents have direct sightlines onto it.
- Mitigate border vacuums (highways, rail, parking) with active programming on the still-permeable edges and treat the hostile edge as a design challenge.
Data sources
- City of Toronto Open Data: Parks (Green Space)Polygon boundaries, official names, types.
- Parks & Recreation FacilitiesInventory of in-park amenities (washrooms, fields, rinks…).
- Toronto Pedestrian NetworkSidewalk segments around and through parks; estimated park entrances.
- Toronto Centreline V2Street segments + intersection nodes near park edges; trails and walkways.
- Toronto 3D MassingBuilding footprints + heights for edge-building counts, frontage density, and tower-in-the-park risk.
- Toronto Treed AreaTree canopy share inside park polygons via stratified-grid sampling.
- Toronto Waterbodies & RiversWater surface inside parks + nearest-water distance for cooling.
- Ravine & Natural Feature ProtectionRavine overlap as a cooling / natural-comfort signal.
- Toronto Street Tree InventoryTree count + density inside park polygons.
- Neighbourhood Profiles(Pending) Equity context proxy.
- OpenStreetMap (Overpass API)Cafés, restaurants, retail, transit stops, parking, highways, rail.