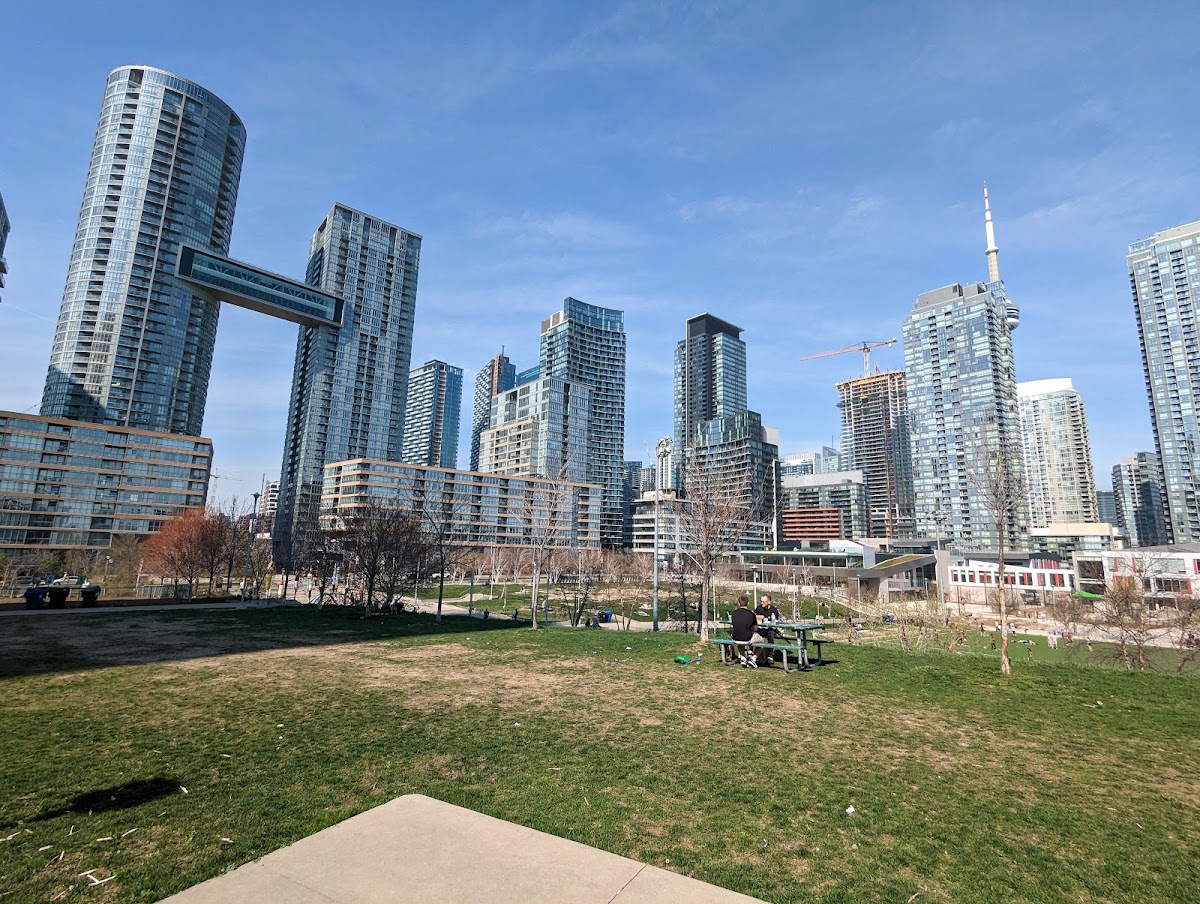
Canoe Landing
Athletic / Recreation Park, in the top tier overall (score 48, rank ~93th percentile). Strongest: amenity diversity; weakest: natural comfort.
Photo by Todd Tyrtle via Google Places · cached 5/9/2026
Canoe Landing scores 47.9 / 100. Strongest dimensions: enclosure / eyes on park and connectivity. Weakest: amenity diversity (28.4). Border-vacuum risk is elevated (30). This score is a transparent reading of Jane Jacobs-style vitality factors, not a definitive judgment.
Area · 0.85 ha
Weighted across six dimensions · confidence 68%
Scores are not bell-curved. Percentiles and expected scores provide context without changing the underlying model.
Loading map…
The parks map is loading.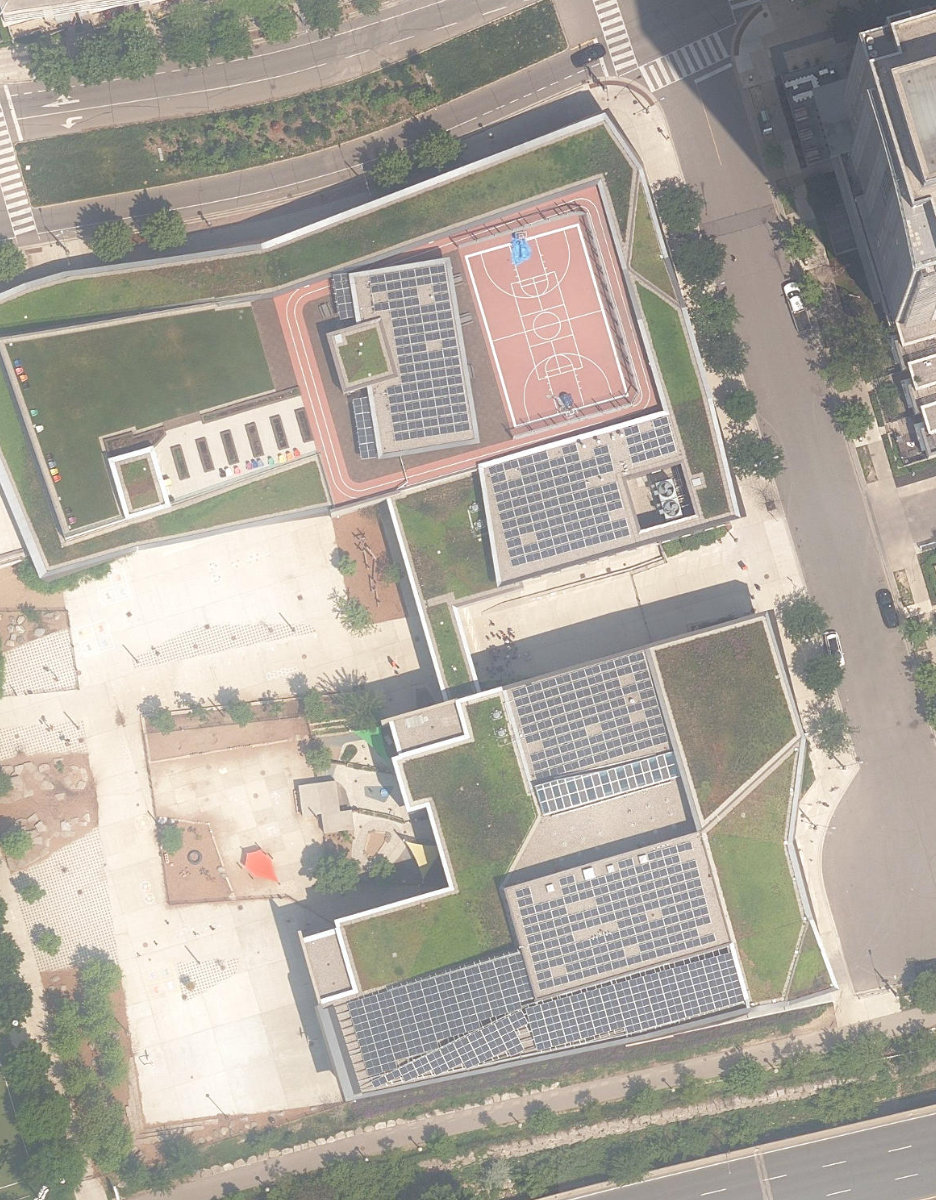
Explain this score
Where did the 48 come from? Each weighted contribution against a neutral 50 baseline. Green = pushed up; red = pulled down.
Sum of contributions = the headline score. A negative bar means that dimension dragged the park below the city-wide neutral baseline.
Why this park works
Canoe Landing works because its amenity diversity score (28) is one of the city's strongest and its edge activation (38) is also top decile.
What limits this park
Canoe Landing's edges are fronted by border-vacuum land uses (highways, rail, parking, blank institutional), risk score 30.
Most distinctive characteristic
Most distinctive feature: exceptionally high amenity diversity (28, top decile).
Jacobs reading
Canoe Landing sits between an urban social park and an ecological retreat: moderately useful for both, exceptionally suited to neither.
Tradeoffs
- 5 nearby towers cast wind and shadow without contributing canopy: passive surveillance is plentiful but human-scale comfort is not.
Performance in context
- A modest overperformer for its athletic / recreation park typology (+6 vs the median in Athletic / Recreation Park).
Typology classification
Classified as Athletic / Recreation Park: 67% of amenity types are athletic (basketball, track)
Edge Activation
Within 100 m of the park edge: 14 active uses (school, restaurant, retail, cafe) and 4 dead/hostile uses (highway). Active edges keep "eyes on the park" through the day; parking lots, blank institutional walls, rail and highway frontages drain street life.
Source: OSM POIs (amenity/shop) + Toronto Building Footprints + land use
Connectivity
Connectivity blends paths, intersections, transit, entrances, and edge density. This park has 9 mapped paths/walkways and 20 sidewalk segments within 50 m; 6 street intersections within 100 m; 12 transit stops within a 400 m walk; 0 estimated access points across ~391 m of perimeter. edge density is healthy, no superblock penalty. Source coverage: centreline, pedestrian_network, transit_osm.
Source: Toronto Centreline V2 + Pedestrian Network + OSM transit stops
Amenity Diversity
3 distinct amenity types in the park (basketball, playground, track). Diversity, not raw count, drives the score so a park with many distinct activity types can outrank a larger park that repeats the same use.
Source: Toronto Parks & Recreation Facilities + OSM amenity tags
Natural Comfort
Natural-comfort components for this park: ~11.9% effective canopy (0.0% from contiguous tree polygons + scattered tree density); nearest waterbody ~307 m; 17 city-mapped trees inside the polygon (17.0/ha). Reading: exposed. Source coverage: waterbodies, street_trees. Impervious surface is approximated (Toronto's authoritative layer ships only as a raster GeoTIFF).
Source: Toronto Treed Area + Ravine + Waterbodies + Street Tree Inventory
Enclosure / Eyes on Park
21 buildings within 25 m of the park edge (11 mid-rise, 5 low-rise, 5 tower); avg edge height 31.1 m (~10 floors); 5.4 buildings per 100 m of 391 m perimeter (strong frontage density); edges lean tall but still framed; 5 towers ≥ 40 m within 25 m of the edge. "Eyes on the park" come strongest from the 11 mid-rise edge buildings.
Source: Toronto 3D Massing (building footprints + heights)
Border Vacuum Risk
Border-vacuum factors within 50 m of the park: Lake Shore Boulevard West. Jacobs warned that highways, rail, parking lots and blank institutional edges act as "vacuums" that suppress foot traffic and isolate the park from its neighbourhood.
Source: Toronto Street Centreline (highways) + rail layer + OSM landuse + building footprints
Equity Context
Equity Context requires inputs not yet loaded for this park (Toronto Neighbourhood Profiles). Score is held at a neutral 50 with low confidence. Read with caution.
Source: Toronto Neighbourhood Profiles
Amenities (3 types · 3 records)
- basketball
- playground
- track
Nearby active-edge features (66)
- school: Bishop Macdonell Catholic Elementary School0 m
- school: Jean Lumb Public School0 m
- restaurant: Fox and Fiddle29 m
- highway: Lake Shore Boulevard West32 m
- retail: Evolve Hair Studio38 m
- retail: Sobeys54 m
- retail: Chez Leon55 m
- retail: WAGSUP Fort York City Place59 m
- retail: Myodetox64 m
- retail: 52 Barber Studio67 m
- highway: Lake Shore Boulevard West70 m
- highway: Gardiner Expressway71 m
- retail: The Wine Shop74 m
- retail: Kathy Nails & Sp76 m
- highway: Gardiner Expressway77 m
- retail: Skin Forward77 m
- cafe: Bobo Tea & Juice85 m
- cafe: Starbucks100 m
- restaurant: Hunters Landing108 m
- highway: Lake Shore Boulevard West108 m
- highway: Lake Shore Boulevard West125 m
- highway: Lake Shore Boulevard West126 m
- highway: Lake Shore Boulevard West129 m
- restaurant: Liberty Shawarma130 m
- school: Milne Acting Studio131 m
- highway: Lake Shore Boulevard West132 m
- transit stop: Bremner Boulevard139 m
- restaurant: Fort York Tavern140 m
- highway: Lake Shore Boulevard West150 m
- rail: Union Station Rail Corridor151 m
- restaurant: The Morning After151 m
- retail: Duende Beauty Salon155 m
- rail: Union Station Rail Corridor155 m
- restaurant: Fat Bastard Burrito158 m
- parking lot159 m
- rail: Union Station Rail Corridor159 m
- restaurant: Chin Chin Street Side Kitchen160 m
- retail: Harbourfront Eye Care160 m
- retail: Cosmopawlitan160 m
- retail: Edible Arrangements161 m
- parking lot163 m
- transit stop: Bremner Boulevard165 m
- retail: Salon 500 Hair and Esthetics166 m
- highway: Lake Shore Boulevard West166 m
- retail: Woolove Apparel168 m
- retail: Snatched TO169 m
- cafe: Music Garden Cafe170 m
- retail: Crista Nicole Brows Beauty172 m
- retail: Solace Tanning Studios173 m
- retail: RP Nails176 m
- rail: Union Station Rail Corridor177 m
- parking lot177 m
- cafe: Sip Smile Repeat178 m
- cafe: Boba Boy179 m
- rail: Union Station Rail Corridor181 m
- rail: Union Station Rail Corridor184 m
- rail: Union Station Rail Corridor185 m
- rail: Union Station Rail Corridor185 m
- retail: Omnya Health187 m
- retail: The Beauty House191 m
- rail: Union Station Rail Corridor196 m
- restaurant: Dairy Queen197 m
- transit stop: Spadina Avenue197 m
- restaurant: Orange Julius197 m
- transit stop: Queens Quay Loop at Lower Spadina Ave199 m
- restaurant: Subway200 m
Park profile
Five-axis radar across the structural dimensions.
Citywide percentile ranks
Across all Toronto parks in the dataset.
- Overall vitality93th
- Edge activation91th
- Connectivity72th
- Amenity diversity95th
- Natural comfort54th
- Enclosure65th
Most similar parks
Closest in metric space across the five structural dimensions.
- Balmoral ParkNeighbourhood Park52
- Cliffwood ParkAthletic / Recreation Park52
- Van Horne ParkNeighbourhood Park45
- Tournament ParkNeighbourhood Park54
- Fountainhead ParkNeighbourhood Park49
Most opposite parks
Furthest in metric space. Useful for recognising what kind of park this isn’t.
- Trca Lands ( 26)Ravine / Naturalized Park27
- Toronto Islands - Muggs Island ParkRavine / Naturalized Park25
- Rouge ParkRavine / Naturalized Park28
- Rouge ParkWaterfront Park25
- Rouge ParkRavine / Naturalized Park26
Visitor signals
Public attention measured by Google Places aggregates. This proxies attention, not occupancy. Aggregate-only: no usernames, no review text, no extra photos beyond the cached hero.
“Open space featuring 2 multi-purpose sports fields, various contemporary art pieces & walking paths.” (Google editorial summary)
p96 citywide · p100 within Athletic / Recreation Park
Source: Google Places API · match high (0.80 composite confidence) · last refreshed 5/9/2026. Privacy contract. Measures public attention, not occupancy.
Human activity signals: not available
No activity signals have landed for this park yet. The model has scored its physical form but it can’t yet say how often it’s programmed, photographed, or walked through. See /data-ethics for what we will and will not collect.
Does this score feel accurate?
Your read of Canoe Landingmatters. We’re testing whether the model lines up with how people actually use the park. Submissions are stored locally; no account needed.
Tell us how this park feels
We measure structure (canopy, edges, connectivity). You measure feeling. Both matter, and disagreement is itself useful civic data.
What would improve this park?
Generated from the weakest measured dimensions: a starting point, not a prescription.
- Activate the edges: encourage cafés, retail or community uses on the streets that face the park; replace blank or parking-lot edges where possible.
- Diversify what people can do in the park (playground, washroom, water, shade, performance, sport, garden): even small additions raise this score.
- Increase canopy and reduce paved area. Shade and water features extend usable hours and seasons.
- Mitigate border vacuums (highways, rail, parking) with active programming on the still-permeable edges and treat the hostile edge as a design challenge.
Data sources
- City of Toronto Open Data: Parks (Green Space)Polygon boundaries, official names, types.
- Parks & Recreation FacilitiesInventory of in-park amenities (washrooms, fields, rinks…).
- Toronto Pedestrian NetworkSidewalk segments around and through parks; estimated park entrances.
- Toronto Centreline V2Street segments + intersection nodes near park edges; trails and walkways.
- Toronto 3D MassingBuilding footprints + heights for edge-building counts, frontage density, and tower-in-the-park risk.
- Toronto Treed AreaTree canopy share inside park polygons via stratified-grid sampling.
- Toronto Waterbodies & RiversWater surface inside parks + nearest-water distance for cooling.
- Ravine & Natural Feature ProtectionRavine overlap as a cooling / natural-comfort signal.
- Toronto Street Tree InventoryTree count + density inside park polygons.
- Neighbourhood Profiles(Pending) Equity context proxy.
- OpenStreetMap (Overpass API)Cafés, restaurants, retail, transit stops, parking, highways, rail.