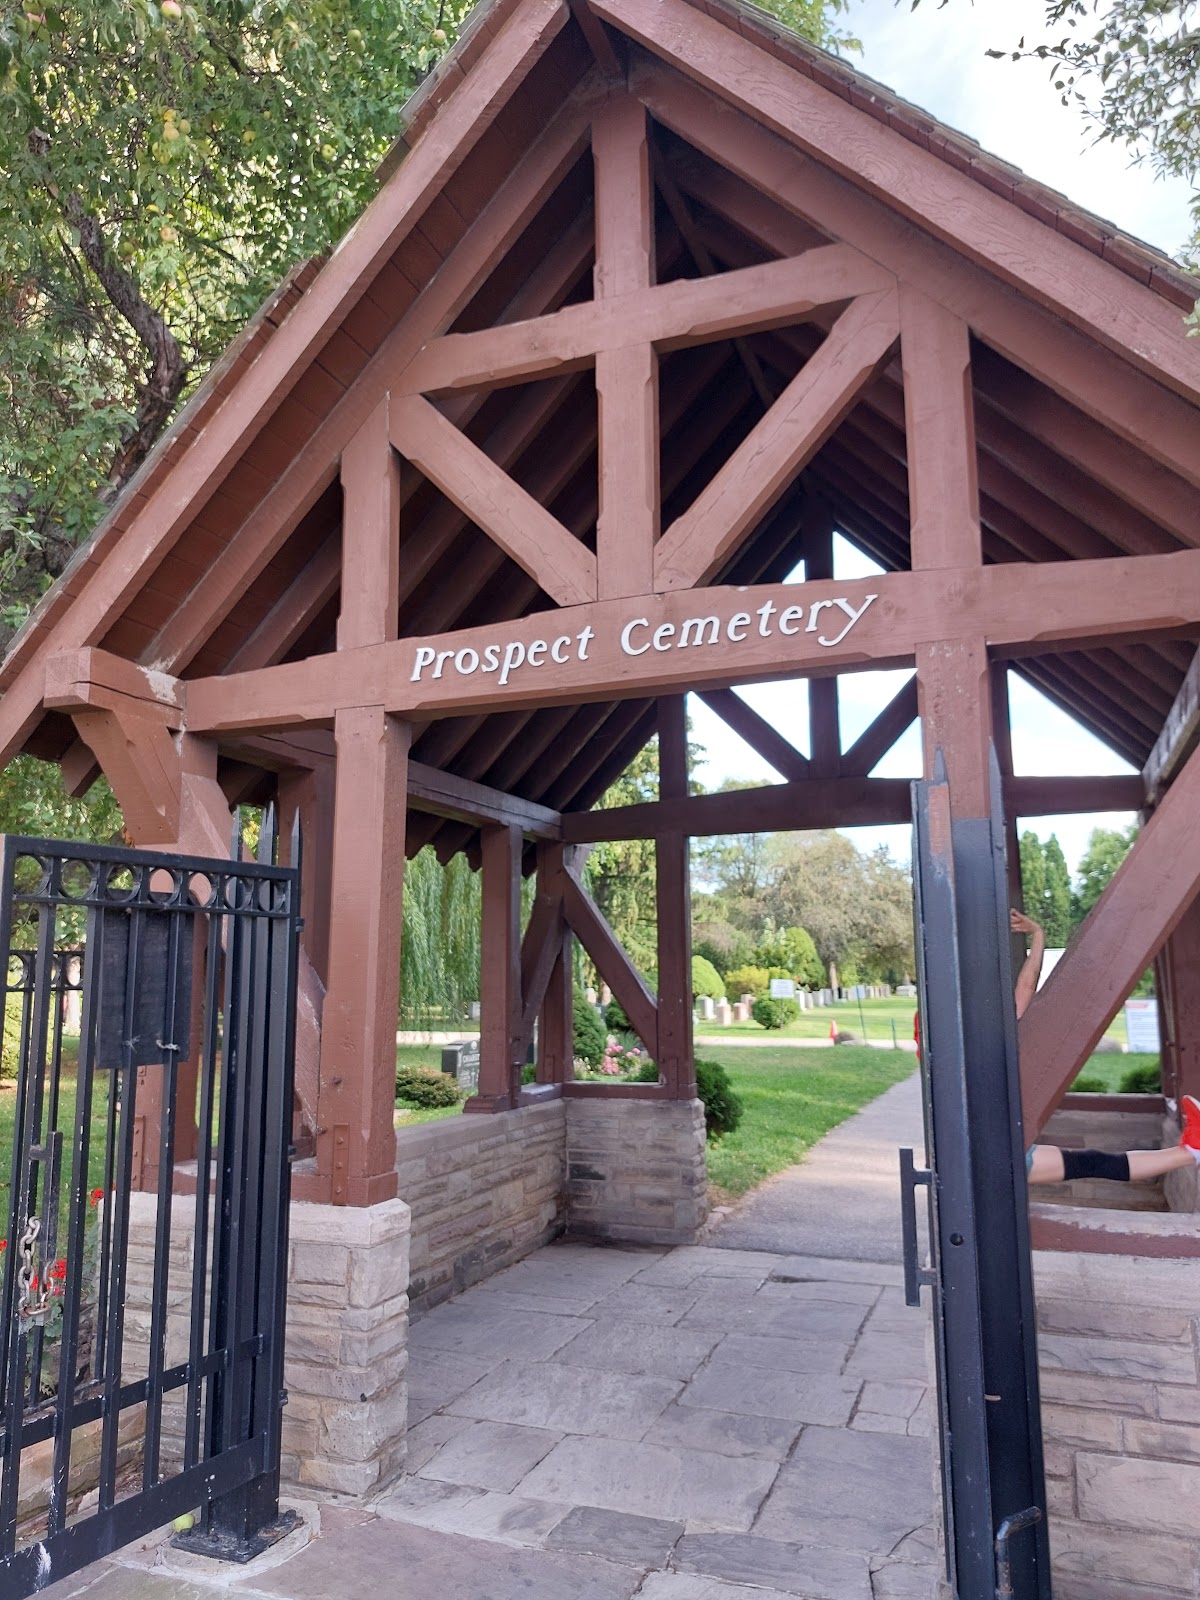
Prospect Cemetery
Neighbourhood Park, in the top tier overall (score 44, rank ~86th percentile). Strongest: connectivity; weakest: amenity diversity.
Photo by Ian Totman via Google Places · cached 5/9/2026
Prospect Cemetery scores 43.6 / 100. Strongest dimensions: connectivity and enclosure / eyes on park. Weakest: amenity diversity (0). Border-vacuum risk is low. This score is a transparent reading of Jane Jacobs-style vitality factors, not a definitive judgment.
Area · 17.37 ha
Weighted across six dimensions · confidence 56%
Scores are not bell-curved. Percentiles and expected scores provide context without changing the underlying model.
Loading map…
The parks map is loading.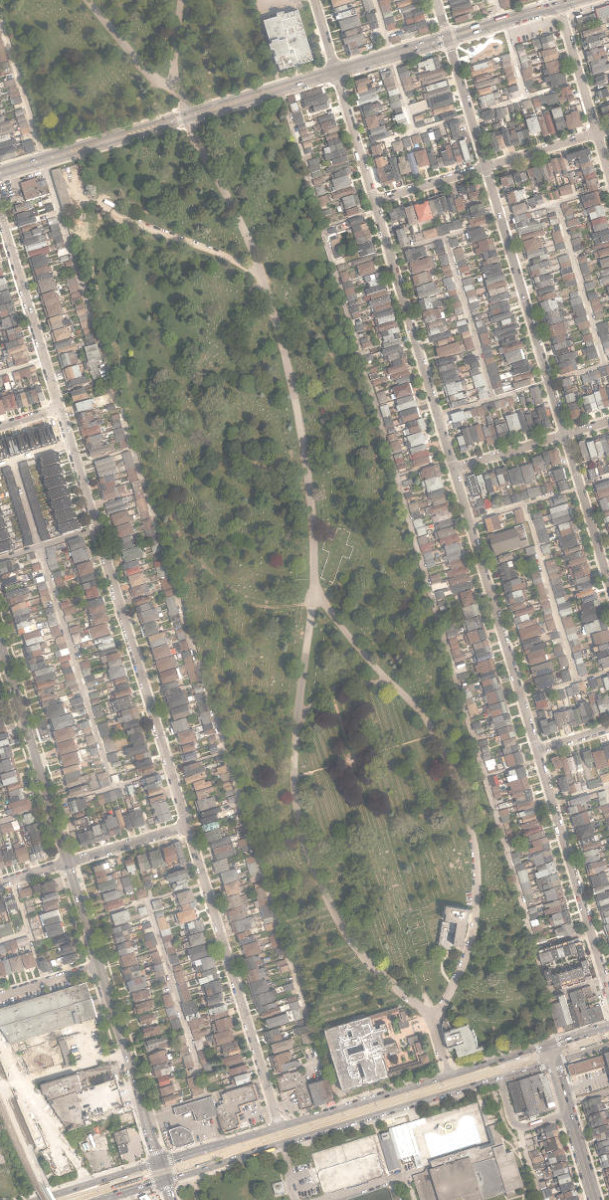
Explain this score
Where did the 44 come from? Each weighted contribution against a neutral 50 baseline. Green = pushed up; red = pulled down.
Sum of contributions = the headline score. A negative bar means that dimension dragged the park below the city-wide neutral baseline.
Why this park works
Prospect Cemetery works because its connectivity score (75) is one of the city's strongest and its edge activation (27) is also top quartile (35 transit stops sit within a 400 m walk; 42 intersections fall within 100 m of the edge).
What limits this park
Prospect Cemetery is held back by amenity diversity (0, bottom quartile).
Most distinctive characteristic
Most distinctive feature: exceptionally high connectivity (75, top decile).
Jacobs reading
Prospect Cemetery sits between an urban social park and an ecological retreat: moderately useful for both, exceptionally suited to neither.
Tradeoffs
- Connectivity (75) significantly outpaces natural comfort (31): well placed in the city but offers little shade or ecological respite.
Performance in context
- A modest overperformer for its neighbourhood park typology (+9 vs the median in large Neighbourhood Park).
Typology classification
Classified as Neighbourhood Park: 17.4 ha, framed by 12 mid-rise vs 0 towers
Edge Activation
Within 100 m of the park edge: 30 active uses (retail, restaurant, community, transit_stop, cafe) and 7 dead/hostile uses (parking_lot). Active edges keep "eyes on the park" through the day; parking lots, blank institutional walls, rail and highway frontages drain street life.
Source: OSM POIs (amenity/shop) + Toronto Building Footprints + land use
Connectivity
Connectivity blends paths, intersections, transit, entrances, and edge density. This park has 1 mapped paths/walkways and 45 sidewalk segments within 50 m; 42 street intersections within 100 m; 35 transit stops within a 400 m walk; 4 estimated access points across ~2,100 m of perimeter. edge density is healthy, no superblock penalty. Source coverage: centreline, pedestrian_network, transit_osm.
Source: Toronto Centreline V2 + Pedestrian Network + OSM transit stops
Amenity Diversity
No amenities recorded. Score is 0 until inventory is loaded.
Source: Toronto Parks & Recreation Facilities + OSM amenity tags
Natural Comfort
Natural-comfort components for this park: 0.0% estimated tree canopy; 13 city-mapped trees inside the polygon (0.8/ha). Reading: exposed. Source coverage: street_trees. Impervious surface is approximated (Toronto's authoritative layer ships only as a raster GeoTIFF).
Source: Toronto Treed Area + Ravine + Waterbodies + Street Tree Inventory
Enclosure / Eyes on Park
445 buildings within 25 m of the park edge (12 mid-rise, 433 low-rise, 0 tower); avg edge height 6.4 m (~2 floors); 21.2 buildings per 100 m of 2,100 m perimeter (strong frontage density); edges are low-rise (mostly 2 to 3 floors); no towers immediately adjacent. "Eyes on the park" come strongest from the 12 mid-rise edge buildings.
Source: Toronto 3D Massing (building footprints + heights)
Border Vacuum Risk
Park edges face the city. No significant border vacuum detected.
Source: Toronto Street Centreline (highways) + rail layer + OSM landuse + building footprints
Equity Context
Equity Context requires inputs not yet loaded for this park (Toronto Neighbourhood Profiles). Score is held at a neutral 50 with low confidence. Read with caution.
Source: Toronto Neighbourhood Profiles
Amenities (0)
No amenities recorded for this park.
Nearby active-edge features (75)
- transit stop3 m
- restaurant: Castelo Sports Bar4 m
- restaurant: Ti Carlo's Bar5 m
- retail: Astro Meats10 m
- transit stop: Lansdowne13 m
- retail: Verdi17 m
- transit stop20 m
- restaurant: Cafe 51228 m
- transit stop: St Clair Avenue West32 m
- cafe: La Paloma33 m
- restaurant: Poop Cafe34 m
- restaurant: Rain Sushi34 m
- cafe: Poop-A-Licious34 m
- restaurant: Agio Ristorante34 m
- restaurant: 241 Pizza35 m
- transit stop: Lansdowne36 m
- transit stop: St Clair Avenue West38 m
- retail: VK Optical41 m
- transit stop: Lansdowne Avenue52 m
- parking lot53 m
- retail: Ital Record & Sport61 m
- retail: Sao Miguel Grocery's LTD64 m
- restaurant: Sway71 m
- restaurant: O Espeta Bar & Grill71 m
- parking lot73 m
- parking lot74 m
- retail: Jasmine79 m
- retail: Lovely Story79 m
- restaurant: Don Quixote80 m
- retail: Sunshine Market85 m
- parking lot85 m
- parking lot86 m
- retail: Nova Era90 m
- retail: Ontario Fashion Textiles94 m
- community: Joseph J. Piccininni Community Centre95 m
- parking lot96 m
- parking lot100 m
- restaurant: Frank's Pizza House105 m
- transit stop: St Clair Avenue West109 m
- cafe: Settemila Cafe110 m
- retail: Tanyas111 m
- transit stop: Nairn Avenue113 m
- parking lot115 m
- retail: Freedom Mobile116 m
- parking lot119 m
- retail122 m
- retail: Praia de Mira126 m
- cafe126 m
- transit stop: Caledonia128 m
- transit stop: Caledonia Road133 m
- restaurant: La Bruschetta134 m
- retail: Pronta138 m
- cafe: Chappa Corner Cafe140 m
- parking lot142 m
- transit stop: Rogers Rd at Caledonia Rd144 m
- retail: Caledonia Bakery & Pastry144 m
- retail: Tre Mari Bakery145 m
- transit stop: Nairn Avenue146 m
- transit stop: Rogers Road152 m
- transit stop: Norman Avenue156 m
- transit stop: 175 Caledonia Road157 m
- transit stop: Innes Avenue157 m
- retail: Tessuti Venezia158 m
- transit stop: 180 Caledonia Road167 m
- retail: Cabreira Meats168 m
- transit stop: Norman Avenue168 m
- transit stop: Innes Avenue168 m
- restaurant: Flavours of Sheba170 m
- retail: Diana Grocery175 m
- retail: Bobrowski Textiles181 m
- transit stop: Rogers Rd at Caledonia Rd184 m
- restaurant: Kapital Resturant and Grill185 m
- restaurant: Dairy Freeze186 m
- transit stop: Rogers Road188 m
- retail: John's Butcher Shop192 m
Park profile
Five-axis radar across the structural dimensions.
Citywide percentile ranks
Across all Toronto parks in the dataset.
- Overall vitality86th
- Edge activation86th
- Connectivity96th
- Amenity diversity14th
- Natural comfort14th
- Enclosure70th
Most similar parks
Closest in metric space across the five structural dimensions.
- Bartlett ParketteUrban Plaza44
- Joseph Sheard ParketteUrban Plaza44
- Gateway ParkCivic Square41
- Scarborough Hydro Green SpaceNeighbourhood Park40
- Chandos Park SouthParkette39
Most opposite parks
Furthest in metric space. Useful for recognising what kind of park this isn’t.
- Trca Lands ( 26)Ravine / Naturalized Park27
- Toronto Islands - Muggs Island ParkRavine / Naturalized Park25
- Rouge ParkRavine / Naturalized Park28
- Rouge ParkRavine / Naturalized Park26
- Rouge ParkWaterfront Park25
Visitor signals
Public attention measured by Google Places aggregates. This proxies attention, not occupancy. Aggregate-only: no usernames, no review text, no extra photos beyond the cached hero.
p11 citywide · p14 within Neighbourhood Park
Source: Google Places API · match medium (0.81 composite confidence) · last refreshed 5/9/2026. Privacy contract. Measures public attention, not occupancy.
Human activity signals: not available
No activity signals have landed for this park yet. The model has scored its physical form but it can’t yet say how often it’s programmed, photographed, or walked through. See /data-ethics for what we will and will not collect.
Does this score feel accurate?
Your read of Prospect Cemeterymatters. We’re testing whether the model lines up with how people actually use the park. Submissions are stored locally; no account needed.
Tell us how this park feels
We measure structure (canopy, edges, connectivity). You measure feeling. Both matter, and disagreement is itself useful civic data.
What would improve this park?
Generated from the weakest measured dimensions: a starting point, not a prescription.
- Activate the edges: encourage cafés, retail or community uses on the streets that face the park; replace blank or parking-lot edges where possible.
- Diversify what people can do in the park (playground, washroom, water, shade, performance, sport, garden): even small additions raise this score.
- Increase canopy and reduce paved area. Shade and water features extend usable hours and seasons.
Data sources
- City of Toronto Open Data: Parks (Green Space)Polygon boundaries, official names, types.
- Parks & Recreation FacilitiesInventory of in-park amenities (washrooms, fields, rinks…).
- Toronto Pedestrian NetworkSidewalk segments around and through parks; estimated park entrances.
- Toronto Centreline V2Street segments + intersection nodes near park edges; trails and walkways.
- Toronto 3D MassingBuilding footprints + heights for edge-building counts, frontage density, and tower-in-the-park risk.
- Toronto Treed AreaTree canopy share inside park polygons via stratified-grid sampling.
- Toronto Waterbodies & RiversWater surface inside parks + nearest-water distance for cooling.
- Ravine & Natural Feature ProtectionRavine overlap as a cooling / natural-comfort signal.
- Toronto Street Tree InventoryTree count + density inside park polygons.
- Neighbourhood Profiles(Pending) Equity context proxy.
- OpenStreetMap (Overpass API)Cafés, restaurants, retail, transit stops, parking, highways, rail.