Mount Pleasant Cemetery
Other, above average overall (score 41, rank ~80th percentile). Strongest: connectivity; weakest: amenity diversity.
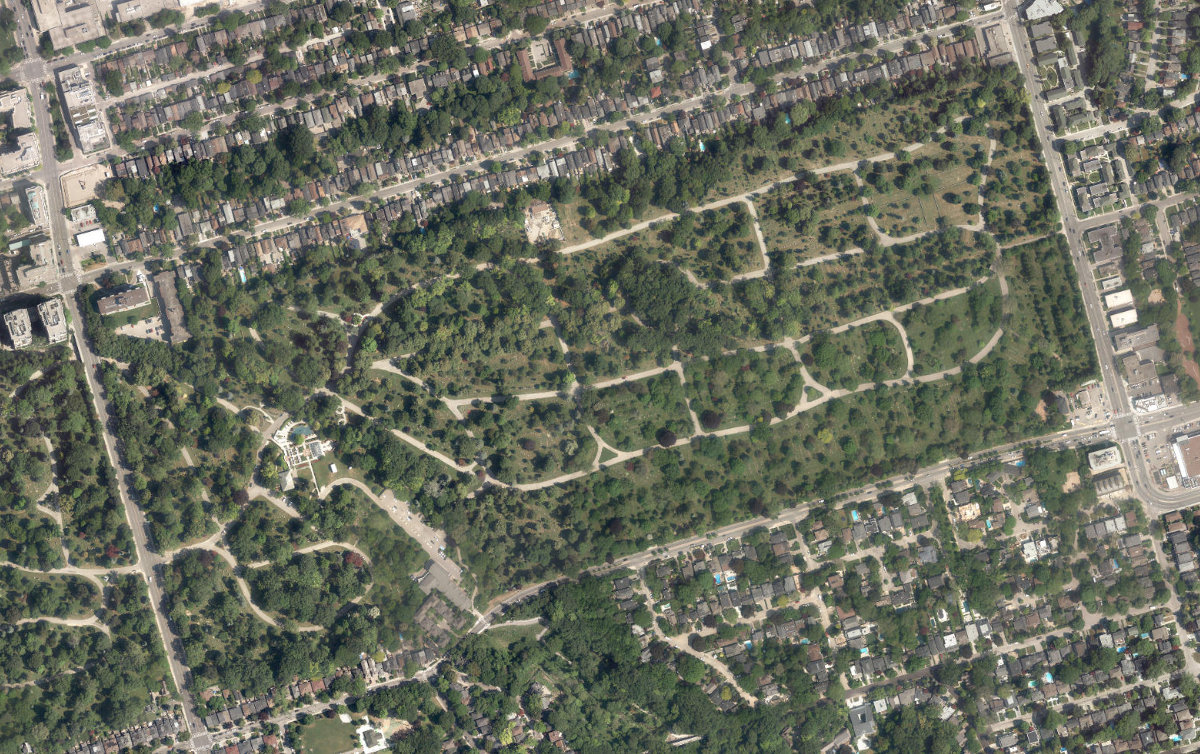
Aerial, City of Toronto orthophoto, ~8 cm/px source · cached 5/9/2026
Mount Pleasant Cemetery scores 41.4 / 100. Strongest dimensions: connectivity and enclosure / eyes on park. Weakest: amenity diversity (0). Border-vacuum risk is elevated (60). This score is a transparent reading of Jane Jacobs-style vitality factors, not a definitive judgment.
Area · 42.84 ha
Weighted across six dimensions · confidence 63%
Scores are not bell-curved. Percentiles and expected scores provide context without changing the underlying model.
Loading map…
The parks map is loading.Explain this score
Where did the 41 come from? Each weighted contribution against a neutral 50 baseline. Green = pushed up; red = pulled down.
Sum of contributions = the headline score. A negative bar means that dimension dragged the park below the city-wide neutral baseline.
Why this park works
Mount Pleasant Cemetery works because its connectivity score (74) is in the top tier and its edge activation (25) is also top quartile (40 transit stops sit within a 400 m walk; 27 intersections fall within 100 m of the edge).
What limits this park
Mount Pleasant Cemetery's edges are fronted by border-vacuum land uses (highways, rail, parking, blank institutional), risk score 60.
Most distinctive characteristic
Most distinctive feature: exceptionally high connectivity (74, top decile).
Jacobs reading
Mount Pleasant Cemetery sits between an urban social park and an ecological retreat: moderately useful for both, exceptionally suited to neither.
Tradeoffs
- High connectivity coexists with high border-vacuum risk (60): much of that connectivity is to highways, rail, or parking lots, not to neighbourhoods.
Performance in context
- This park is a strong overperformer for its cohort: raw 41 versus an expected 26 for similar parks (Other) (gap +16).
Typology classification
Classified as Other: does not meet any specific typology threshold (42.8 ha, 0 amenity types, frontage 11.8/100m)
Edge Activation
Within 100 m of the park edge: 26 active uses (transit_stop, retail, restaurant) and 7 dead/hostile uses (parking_lot). Active edges keep "eyes on the park" through the day; parking lots, blank institutional walls, rail and highway frontages drain street life.
Source: OSM POIs (amenity/shop) + Toronto Building Footprints + land use
Connectivity
Connectivity blends paths, intersections, transit, entrances, and edge density. This park has 11 mapped paths/walkways and 51 sidewalk segments within 50 m; 27 street intersections within 100 m; 40 transit stops within a 400 m walk; 5 estimated access points across ~3,123 m of perimeter. moderate edge density, small superblock penalty applied. Source coverage: centreline, pedestrian_network, transit_osm.
Source: Toronto Centreline V2 + Pedestrian Network + OSM transit stops
Amenity Diversity
No amenities recorded. Score is 0 until inventory is loaded.
Source: Toronto Parks & Recreation Facilities + OSM amenity tags
Natural Comfort
Natural-comfort components for this park: 19.3% estimated tree canopy; nearest waterbody ~289 m; 14 city-mapped trees inside the polygon (0.3/ha). Reading: exposed. Source coverage: treed_area, waterbodies, street_trees. Impervious surface is approximated (Toronto's authoritative layer ships only as a raster GeoTIFF).
Source: Toronto Treed Area + Ravine + Waterbodies + Street Tree Inventory
Enclosure / Eyes on Park
370 buildings within 25 m of the park edge (36 mid-rise, 332 low-rise, 2 tower); avg edge height 7.1 m (~2 floors); 11.8 buildings per 100 m of 3,123 m perimeter (strong frontage density); edges are low-rise (mostly 2 to 3 floors); 2 towers ≥ 40 m within 25 m of the edge. "Eyes on the park" come strongest from the 36 mid-rise edge buildings.
Source: Toronto 3D Massing (building footprints + heights)
Border Vacuum Risk
Border-vacuum factors within 50 m of the park: parking_lot, parking_lot, parking_lot, parking_lot, parking_lot. Jacobs warned that highways, rail, parking lots and blank institutional edges act as "vacuums" that suppress foot traffic and isolate the park from its neighbourhood.
Source: Toronto Street Centreline (highways) + rail layer + OSM landuse + building footprints
Equity Context
Equity Context requires inputs not yet loaded for this park (Toronto Neighbourhood Profiles). Score is held at a neutral 50 with low confidence. Read with caution.
Source: Toronto Neighbourhood Profiles
Amenities (0)
No amenities recorded for this park.
Nearby active-edge features (51)
- parking lot0 m
- parking lot0 m
- parking lot0 m
- transit stop: Brendan Road2 m
- transit stop: Orchard Green2 m
- transit stop: Mount Pleasant Cemetery3 m
- transit stop: Lumley Avenue4 m
- transit stop: Brendan Road18 m
- retail: Bayview Moore Automotive18 m
- transit stop: Orchard Green19 m
- transit stop: Mount Pleasant Cemetery19 m
- retail: Hasty Market23 m
- transit stop: Lumley Avenue25 m
- transit stop: Bayview Ave at Moore Ave North Side26 m
- transit stop: Sutherland Dr at Bayview Ave27 m
- retail: Global Hearing Aid Clinic28 m
- parking lot29 m
- transit stop: Bayview Ave at Moore Ave29 m
- parking lot33 m
- retail: Bayview Rug Gallery35 m
- transit stop: Bayview Ave at Sutherland Dr East Side41 m
- transit stop: Bayview Ave at McRae Dr43 m
- restaurant: Pizza Hut43 m
- parking lot55 m
- retail: a la spa + beauty bar62 m
- transit stop: Moore Avenue64 m
- transit stop: Bayview Ave at Merton St67 m
- transit stop: Merton Street70 m
- restaurant: Dhillon's Karahi77 m
- transit stop: Moore Avenue82 m
- retail: WhitePia Cleaners82 m
- retail: Mount Pleasant Pet Grooming88 m
- parking lot89 m
- transit stop: Merton Street101 m
- parking lot111 m
- parking lot115 m
- cafe: Starbucks125 m
- retail: Bosley Real Estate142 m
- parking lot144 m
- parking lot146 m
- cafe: Tim Hortons159 m
- retail: Circle K162 m
- parking lot164 m
- parking lot166 m
- parking lot166 m
- parking lot177 m
- transit stop189 m
- parking lot193 m
- parking lot194 m
- transit stop: Sutherland Dr at Bessborough Dr196 m
- parking lot199 m
Park profile
Five-axis radar across the structural dimensions.
Citywide percentile ranks
Across all Toronto parks in the dataset.
- Overall vitality80th
- Edge activation85th
- Connectivity94th
- Amenity diversity58th
- Natural comfort75th
- Enclosure75th
Most similar parks
Closest in metric space across the five structural dimensions.
- Rippleton ParkCorridor / Linear Park46
- Haney ParkRavine / Naturalized Park42
- Memorial Park - YorkCivic Square45
- West Highland Creek WatercourseWaterfront Park45
- College - St. Helens Traffic IslandsUrban Plaza44
Most opposite parks
Furthest in metric space. Useful for recognising what kind of park this isn’t.
- Toronto Islands - Muggs Island ParkRavine / Naturalized Park25
- Rouge ParkRavine / Naturalized Park21
- Rouge ParkRavine / Naturalized Park18
- Trca Lands ( 26)Ravine / Naturalized Park27
- Trca Lands ( 58)Waterfront Park18
Human activity signals: not available
No activity signals have landed for this park yet. The model has scored its physical form but it can’t yet say how often it’s programmed, photographed, or walked through. See /data-ethics for what we will and will not collect.
Does this score feel accurate?
Your read of Mount Pleasant Cemeterymatters. We’re testing whether the model lines up with how people actually use the park. Submissions are stored locally; no account needed.
Tell us how this park feels
We measure structure (canopy, edges, connectivity). You measure feeling. Both matter, and disagreement is itself useful civic data.
What would improve this park?
Generated from the weakest measured dimensions: a starting point, not a prescription.
- Activate the edges: encourage cafés, retail or community uses on the streets that face the park; replace blank or parking-lot edges where possible.
- Diversify what people can do in the park (playground, washroom, water, shade, performance, sport, garden): even small additions raise this score.
- Mitigate border vacuums (highways, rail, parking) with active programming on the still-permeable edges and treat the hostile edge as a design challenge.
Data sources
- City of Toronto Open Data: Parks (Green Space)Polygon boundaries, official names, types.
- Parks & Recreation FacilitiesInventory of in-park amenities (washrooms, fields, rinks…).
- Toronto Pedestrian NetworkSidewalk segments around and through parks; estimated park entrances.
- Toronto Centreline V2Street segments + intersection nodes near park edges; trails and walkways.
- Toronto 3D MassingBuilding footprints + heights for edge-building counts, frontage density, and tower-in-the-park risk.
- Toronto Treed AreaTree canopy share inside park polygons via stratified-grid sampling.
- Toronto Waterbodies & RiversWater surface inside parks + nearest-water distance for cooling.
- Ravine & Natural Feature ProtectionRavine overlap as a cooling / natural-comfort signal.
- Toronto Street Tree InventoryTree count + density inside park polygons.
- Neighbourhood Profiles(Pending) Equity context proxy.
- OpenStreetMap (Overpass API)Cafés, restaurants, retail, transit stops, parking, highways, rail.