Logan Green Field
Urban Plaza, above average overall (score 41, rank ~80th percentile). Strongest: connectivity; weakest: amenity diversity.
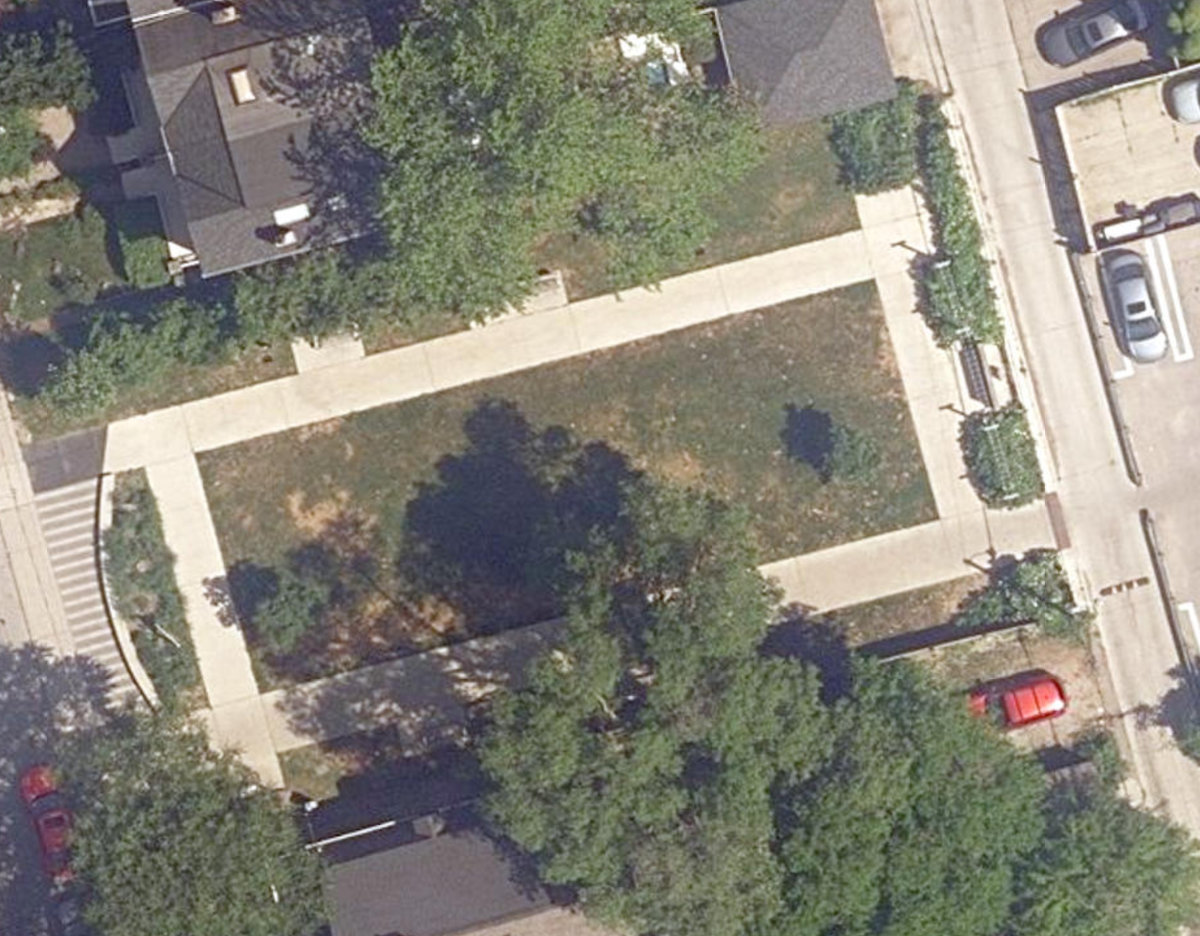
Aerial, City of Toronto orthophoto, ~8 cm/px source · cached 5/9/2026
Logan Green Field scores 41.4 / 100. Strongest dimensions: enclosure / eyes on park and connectivity. Weakest: amenity diversity (0). Border-vacuum risk is low. This score is a transparent reading of Jane Jacobs-style vitality factors, not a definitive judgment.
Area · 0.09 ha
Weighted across six dimensions · confidence 57%
Scores are not bell-curved. Percentiles and expected scores provide context without changing the underlying model.
Loading map…
The parks map is loading.Explain this score
Where did the 41 come from? Each weighted contribution against a neutral 50 baseline. Green = pushed up; red = pulled down.
Sum of contributions = the headline score. A negative bar means that dimension dragged the park below the city-wide neutral baseline.
Why this park works
Logan Green Field works because its connectivity score (73) is in the top tier and its enclosure (84) is also top quartile (19 transit stops sit within a 400 m walk; 13 intersections fall within 100 m of the edge).
What limits this park
Logan Green Field is held back by amenity diversity (0, bottom quartile).
Most distinctive characteristic
Most distinctive feature: exceptionally low amenity diversity (0, bottom quartile).
Jacobs reading
Logan Green Field sits between an urban social park and an ecological retreat: moderately useful for both, exceptionally suited to neither.
Tradeoffs
- Connectivity (73) significantly outpaces natural comfort (36): well placed in the city but offers little shade or ecological respite.
- The park is enclosed by buildings (84) but the surrounding streets are quiet (edge activation 17): frame without animation.
Performance in context
- A modest overperformer for its urban plaza typology (+5 vs the median in pocket Urban Plaza).
Typology classification
Classified as Urban Plaza: 866 m², paved (0% canopy), 63.9 buildings/100 m
Edge Activation
Within 100 m of the park edge: 26 active uses (retail, restaurant, cafe) and 8 dead/hostile uses (parking_lot, highway). Active edges keep "eyes on the park" through the day; parking lots, blank institutional walls, rail and highway frontages drain street life.
Source: OSM POIs (amenity/shop) + Toronto Building Footprints + land use
Connectivity
Connectivity blends paths, intersections, transit, entrances, and edge density. This park has 8 mapped paths/walkways and 13 sidewalk segments within 50 m; 13 street intersections within 100 m; 19 transit stops within a 400 m walk; 3 estimated access points across ~121 m of perimeter. edge density is healthy, no superblock penalty. Source coverage: centreline, pedestrian_network, transit_osm.
Source: Toronto Centreline V2 + Pedestrian Network + OSM transit stops
Amenity Diversity
No amenities recorded. Score is 0 until inventory is loaded.
Source: Toronto Parks & Recreation Facilities + OSM amenity tags
Natural Comfort
Natural-comfort components for this park: ~2.8% effective canopy (0.0% from contiguous tree polygons + scattered tree density); nearest waterbody ~972 m; 4 city-mapped trees inside the polygon (4.0/ha). Reading: exposed. Source coverage: waterbodies, street_trees. Impervious surface is approximated (Toronto's authoritative layer ships only as a raster GeoTIFF).
Source: Toronto Treed Area + Ravine + Waterbodies + Street Tree Inventory
Enclosure / Eyes on Park
77 buildings within 25 m of the park edge (6 mid-rise, 71 low-rise, 0 tower); avg edge height 7.0 m (~2 floors); 63.9 buildings per 100 m of 121 m perimeter (strong frontage density); edges are low-rise (mostly 2 to 3 floors); no towers immediately adjacent. "Eyes on the park" come strongest from the 6 mid-rise edge buildings.
Source: Toronto 3D Massing (building footprints + heights)
Border Vacuum Risk
Border-vacuum factors within 50 m of the park: parking_lot. Jacobs warned that highways, rail, parking lots and blank institutional edges act as "vacuums" that suppress foot traffic and isolate the park from its neighbourhood.
Source: Toronto Street Centreline (highways) + rail layer + OSM landuse + building footprints
Equity Context
Equity Context requires inputs not yet loaded for this park (Toronto Neighbourhood Profiles). Score is held at a neutral 50 with low confidence. Read with caution.
Source: Toronto Neighbourhood Profiles
Amenities (0)
No amenities recorded for this park.
Nearby active-edge features (80)
- parking lot21 m
- retail: Lord Byron Men’s Hairstyling36 m
- restaurant: Alexandros47 m
- parking lot55 m
- restaurant: Estiatorio Soulas60 m
- restaurant: Casa Manila60 m
- cafe: Red Rocket Coffee60 m
- retail: Jade Thread and Wax Bar60 m
- restaurant: The Friendly Greek61 m
- retail: blo61 m
- restaurant: Christina’s61 m
- restaurant: Chef Mustafa62 m
- highway: Danforth Avenue75 m
- highway: Danforth Avenue76 m
- cafe: One Gram By Primo80 m
- highway: Danforth Avenue80 m
- highway: Danforth Avenue81 m
- parking lot81 m
- restaurant: The Ballyhoo Public House83 m
- retail: Fruitland86 m
- retail88 m
- highway: Danforth Avenue90 m
- restaurant: El Charro92 m
- restaurant: Mocha Mocha92 m
- restaurant: bb.q Chicken93 m
- restaurant: The Burger's Priest93 m
- retail: Athens Pastries93 m
- restaurant: VIP Billiard & Lounge93 m
- retail: Danforth Barber Shop94 m
- restaurant: Koh Samiji94 m
- retail: Vaffi Salon & Aesthetics94 m
- restaurant: Mary Brown's96 m
- retail: iQLiving99 m
- retail: Lucky Spot100 m
- cafe: 521 Cafe & Bar102 m
- highway: Danforth Avenue104 m
- retail: easyfinancial104 m
- restaurant: Tacos Moras105 m
- retail: Moss106 m
- retail: Rowe Farms108 m
- retail: Sophia's Lingerie109 m
- restaurant: Menali111 m
- retail: Re-Reading113 m
- restaurant: Casa Sushi114 m
- retail115 m
- restaurant: Komi Banh Mi Bar117 m
- cafe: Canela118 m
- restaurant: The Fox&Fiddle119 m
- restaurant: Pizzeria Libretto120 m
- restaurant: Sambal120 m
- restaurant: Monkey Sushi123 m
- restaurant: Mezes126 m
- restaurant: Royalty Cuisine Shawarma127 m
- highway: Danforth Avenue132 m
- cafe: Gong Cha134 m
- restaurant: Ramen Buta-Nibo136 m
- restaurant: Wanas Shawarma137 m
- transit stop: Carlaw Avenue140 m
- restaurant: Sinaloa Factory141 m
- restaurant: Messini142 m
- cafe: Tim Hortons148 m
- restaurant: Rivals Sports Pub148 m
- transit stop: Carlaw Avenue150 m
- highway: Danforth Avenue151 m
- restaurant: Ala Antioch Express153 m
- retail: Healthy Planet157 m
- highway: Danforth Avenue160 m
- restaurant: Kalyvia Restaurant163 m
- restaurant: Katsu Sushi166 m
- restaurant: Tapp’s Bar and Restaurant168 m
- restaurant: Stacked170 m
- parking lot172 m
- retail173 m
- restaurant: Il Fornello174 m
- retail: Urban Curls Boutique176 m
- parking lot177 m
- retail: Ocean's Treasures177 m
- retail: Tsaa180 m
- retail: Carpe Diem181 m
- highway: Danforth Avenue182 m
Park profile
Five-axis radar across the structural dimensions.
Citywide percentile ranks
Across all Toronto parks in the dataset.
- Overall vitality80th
- Edge activation77th
- Connectivity93th
- Amenity diversity1th
- Natural comfort25th
- Enclosure90th
Most similar parks
Closest in metric space across the five structural dimensions.
- Jay Macpherson GreenUrban Plaza41
- Amsterdam SquareCivic Square44
- Frank Stollery ParketteUrban Plaza35
- Salem ParketteUrban Plaza37
- Alexander The Great ParketteUrban Plaza33
Most opposite parks
Furthest in metric space. Useful for recognising what kind of park this isn’t.
- Trca Lands ( 26)Ravine / Naturalized Park27
- Toronto Islands - Muggs Island ParkRavine / Naturalized Park25
- Rouge ParkRavine / Naturalized Park28
- Rouge ParkWaterfront Park25
- Rouge ParkRavine / Naturalized Park26
Human activity signals: not available
No activity signals have landed for this park yet. The model has scored its physical form but it can’t yet say how often it’s programmed, photographed, or walked through. See /data-ethics for what we will and will not collect.
Does this score feel accurate?
Your read of Logan Green Fieldmatters. We’re testing whether the model lines up with how people actually use the park. Submissions are stored locally; no account needed.
Tell us how this park feels
We measure structure (canopy, edges, connectivity). You measure feeling. Both matter, and disagreement is itself useful civic data.
What would improve this park?
Generated from the weakest measured dimensions: a starting point, not a prescription.
- Activate the edges: encourage cafés, retail or community uses on the streets that face the park; replace blank or parking-lot edges where possible.
- Diversify what people can do in the park (playground, washroom, water, shade, performance, sport, garden): even small additions raise this score.
- Increase canopy and reduce paved area. Shade and water features extend usable hours and seasons.
Data sources
- City of Toronto Open Data: Parks (Green Space)Polygon boundaries, official names, types.
- Parks & Recreation FacilitiesInventory of in-park amenities (washrooms, fields, rinks…).
- Toronto Pedestrian NetworkSidewalk segments around and through parks; estimated park entrances.
- Toronto Centreline V2Street segments + intersection nodes near park edges; trails and walkways.
- Toronto 3D MassingBuilding footprints + heights for edge-building counts, frontage density, and tower-in-the-park risk.
- Toronto Treed AreaTree canopy share inside park polygons via stratified-grid sampling.
- Toronto Waterbodies & RiversWater surface inside parks + nearest-water distance for cooling.
- Ravine & Natural Feature ProtectionRavine overlap as a cooling / natural-comfort signal.
- Toronto Street Tree InventoryTree count + density inside park polygons.
- Neighbourhood Profiles(Pending) Equity context proxy.
- OpenStreetMap (Overpass API)Cafés, restaurants, retail, transit stops, parking, highways, rail.