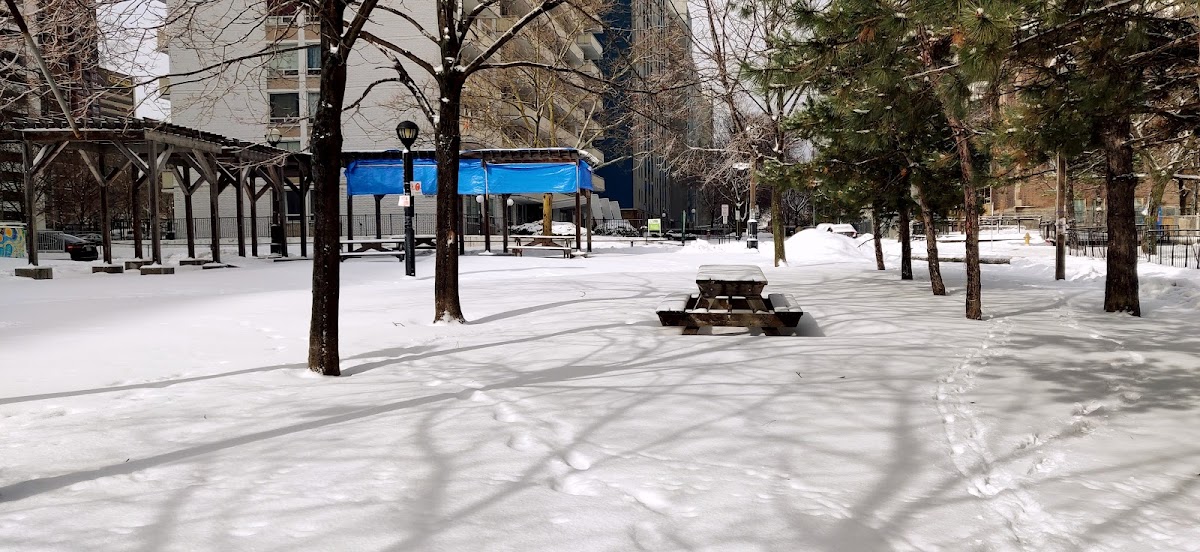
St. James Town West Park
Urban Plaza, in the top tier overall (score 45, rank ~89th percentile). Strongest: enclosure; weakest: natural comfort.
Photo by jsdcanada via Google Places · cached 5/9/2026
St. James Town West Park scores 44.9 / 100. Strongest dimensions: enclosure / eyes on park and connectivity. Weakest: amenity diversity (11.9). Border-vacuum risk is low. This score is a transparent reading of Jane Jacobs-style vitality factors, not a definitive judgment.
Area · 0.42 ha
Weighted across six dimensions · confidence 68%
Scores are not bell-curved. Percentiles and expected scores provide context without changing the underlying model.
Loading map…
The parks map is loading.
Explain this score
Where did the 45 come from? Each weighted contribution against a neutral 50 baseline. Green = pushed up; red = pulled down.
Sum of contributions = the headline score. A negative bar means that dimension dragged the park below the city-wide neutral baseline.
Why this park works
St. James Town West Park works because its enclosure score (91) is one of the city's strongest and its edge activation (27) is also top quartile (43 mid-rise buildings frame the edge with passive surveillance).
What limits this park
St. James Town West Park is held back by natural comfort (35, bottom quartile): only 0% canopy means little summer shade.
Most distinctive characteristic
Most distinctive feature: exceptionally high enclosure (91, top decile).
Jacobs reading
St. James Town West Park sits between an urban social park and an ecological retreat: moderately useful for both, exceptionally suited to neither.
Tradeoffs
- Connectivity (64) significantly outpaces natural comfort (35): well placed in the city but offers little shade or ecological respite.
- 10 nearby towers cast wind and shadow without contributing canopy: passive surveillance is plentiful but human-scale comfort is not.
Performance in context
- A modest overperformer for its urban plaza typology (+6 vs the median in small Urban Plaza).
Typology classification
Classified as Urban Plaza: 4241 m², paved (0% canopy), 21.8 buildings/100 m
Edge Activation
Within 100 m of the park edge: 12 active uses (restaurant, transit_stop, retail) and 5 dead/hostile uses (parking_lot). Active edges keep "eyes on the park" through the day; parking lots, blank institutional walls, rail and highway frontages drain street life.
Source: OSM POIs (amenity/shop) + Toronto Building Footprints + land use
Connectivity
Connectivity blends paths, intersections, transit, entrances, and edge density. This park has 1 mapped paths/walkways and 17 sidewalk segments within 50 m; 12 street intersections within 100 m; 22 transit stops within a 400 m walk; 1 estimated access points across ~362 m of perimeter. edge density is healthy, no superblock penalty. Source coverage: centreline, pedestrian_network, transit_osm.
Source: Toronto Centreline V2 + Pedestrian Network + OSM transit stops
Amenity Diversity
1 distinct amenity types in the park (playground). Diversity, not raw count, drives the score so a park with many distinct activity types can outrank a larger park that repeats the same use.
Source: Toronto Parks & Recreation Facilities + OSM amenity tags
Natural Comfort
Natural-comfort components for this park: ~2.1% effective canopy (0.0% from contiguous tree polygons + scattered tree density); nearest waterbody ~946 m; 3 city-mapped trees inside the polygon (3.0/ha). Reading: exposed. Source coverage: waterbodies, street_trees. Impervious surface is approximated (Toronto's authoritative layer ships only as a raster GeoTIFF).
Source: Toronto Treed Area + Ravine + Waterbodies + Street Tree Inventory
Enclosure / Eyes on Park
79 buildings within 25 m of the park edge (43 mid-rise, 26 low-rise, 10 tower); avg edge height 20.1 m (~7 floors); 21.8 buildings per 100 m of 362 m perimeter (strong frontage density); edges are at a Jacobs-scale walkable mid-rise (3 to 7 floors); 10 towers ≥ 40 m within 25 m of the edge. "Eyes on the park" come strongest from the 43 mid-rise edge buildings.
Source: Toronto 3D Massing (building footprints + heights)
Border Vacuum Risk
Border-vacuum factors within 50 m of the park: parking_lot. Jacobs warned that highways, rail, parking lots and blank institutional edges act as "vacuums" that suppress foot traffic and isolate the park from its neighbourhood.
Source: Toronto Street Centreline (highways) + rail layer + OSM landuse + building footprints
Equity Context
Equity Context requires inputs not yet loaded for this park (Toronto Neighbourhood Profiles). Score is held at a neutral 50 with low confidence. Read with caution.
Source: Toronto Neighbourhood Profiles
Amenities (1 types · 1 records)
- playground
Nearby active-edge features (60)
- retail17 m
- restaurant: Chae's Chester Fried Chicken Express23 m
- retail: RJ's Filipino Foodmart26 m
- retail: Liyu Whole Food Store27 m
- retail: Howard Convenience33 m
- restaurant: Eggsmart34 m
- restaurant: Mahal Kita Restaurant39 m
- parking lot45 m
- transit stop: Isabella Street50 m
- retail: Coin Laundry52 m
- retail55 m
- restaurant: Maison Selby63 m
- restaurant: Gabby's65 m
- parking lot67 m
- parking lot80 m
- parking lot84 m
- parking lot91 m
- retail: Sherbourne Optical104 m
- parking lot106 m
- parking lot109 m
- parking lot111 m
- retail: hear right canada.ca112 m
- transit stop: Sherbourne114 m
- parking lot116 m
- transit stop: Glen Road118 m
- transit stop: Sherbourne118 m
- parking lot119 m
- retail: FreshCo123 m
- parking lot124 m
- rail: Bloor-Danforth Line126 m
- restaurant: Seoul Food129 m
- parking lot130 m
- rail: Bloor-Danforth Line130 m
- transit stop: Bloor Street East131 m
- transit stop: Bloor Street East131 m
- transit stop: Sherbourne Street132 m
- retail: Circle K135 m
- highway: Bloor Street East135 m
- parking lot138 m
- highway: Bloor Street East145 m
- cafe: Tim Hortons146 m
- transit stop: Sherbourne Street148 m
- restaurant: Pita Land150 m
- retail: R&R Discount152 m
- transit stop: Earl Street152 m
- parking lot161 m
- highway: Bloor Street East165 m
- transit stop: Sherbourne Street165 m
- parking lot170 m
- retail: No Frills182 m
- highway: Bloor Street East184 m
- restaurant: Caribbean Taste184 m
- parking lot184 m
- parking lot186 m
- cafe: Aroma Espresso Bar188 m
- retail: Greenwin Gift & Smoke189 m
- retail: Druxy's192 m
- retail: VIP 1 Nail & Spa195 m
- retail: All Around Flowers197 m
- parking lot200 m
Park profile
Five-axis radar across the structural dimensions.
Citywide percentile ranks
Across all Toronto parks in the dataset.
- Overall vitality89th
- Edge activation86th
- Connectivity81th
- Amenity diversity71th
- Natural comfort20th
- Enclosure96th
Most similar parks
Closest in metric space across the five structural dimensions.
- Glenn Gould ParkUrban Plaza45
- KEELE COMMUNITY CENTRE - Building GroundsOther45
- Rita Cox ParkUrban Plaza45
- Dundas - St.Clarens ParketteUrban Plaza47
- Taddle Creek ParkRavine / Naturalized Park43
Most opposite parks
Furthest in metric space. Useful for recognising what kind of park this isn’t.
- Trca Lands ( 26)Ravine / Naturalized Park27
- Toronto Islands - Muggs Island ParkRavine / Naturalized Park25
- Rouge ParkRavine / Naturalized Park28
- Rouge ParkWaterfront Park25
- Rouge ParkRavine / Naturalized Park26
Visitor signals
Public attention measured by Google Places aggregates. This proxies attention, not occupancy. Aggregate-only: no usernames, no review text, no extra photos beyond the cached hero.
p5 citywide · p4 within Urban Plaza
- match flagged for human review, confidence dampened
Source: Google Places API · match needs_review (0.53 composite confidence) · last refreshed 5/9/2026. Privacy contract. Measures public attention, not occupancy.
Human activity signals: not available
No activity signals have landed for this park yet. The model has scored its physical form but it can’t yet say how often it’s programmed, photographed, or walked through. See /data-ethics for what we will and will not collect.
Does this score feel accurate?
Your read of St. James Town West Parkmatters. We’re testing whether the model lines up with how people actually use the park. Submissions are stored locally; no account needed.
Tell us how this park feels
We measure structure (canopy, edges, connectivity). You measure feeling. Both matter, and disagreement is itself useful civic data.
What would improve this park?
Generated from the weakest measured dimensions: a starting point, not a prescription.
- Activate the edges: encourage cafés, retail or community uses on the streets that face the park; replace blank or parking-lot edges where possible.
- Diversify what people can do in the park (playground, washroom, water, shade, performance, sport, garden): even small additions raise this score.
- Increase canopy and reduce paved area. Shade and water features extend usable hours and seasons.
Data sources
- City of Toronto Open Data: Parks (Green Space)Polygon boundaries, official names, types.
- Parks & Recreation FacilitiesInventory of in-park amenities (washrooms, fields, rinks…).
- Toronto Pedestrian NetworkSidewalk segments around and through parks; estimated park entrances.
- Toronto Centreline V2Street segments + intersection nodes near park edges; trails and walkways.
- Toronto 3D MassingBuilding footprints + heights for edge-building counts, frontage density, and tower-in-the-park risk.
- Toronto Treed AreaTree canopy share inside park polygons via stratified-grid sampling.
- Toronto Waterbodies & RiversWater surface inside parks + nearest-water distance for cooling.
- Ravine & Natural Feature ProtectionRavine overlap as a cooling / natural-comfort signal.
- Toronto Street Tree InventoryTree count + density inside park polygons.
- Neighbourhood Profiles(Pending) Equity context proxy.
- OpenStreetMap (Overpass API)Cafés, restaurants, retail, transit stops, parking, highways, rail.