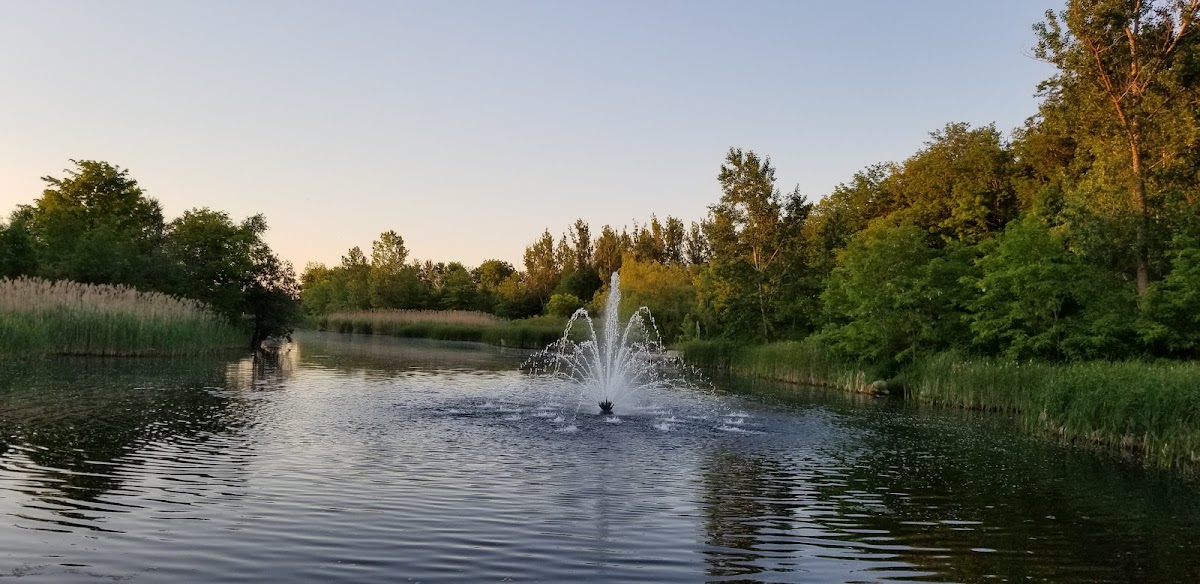
Milliken Park
Destination Park, in the top tier overall (score 46, rank ~91th percentile). Strongest: connectivity; weakest: enclosure.
Photo by K. Johnson via Google Places · cached 5/9/2026
Milliken Park scores 46.4 / 100. Strongest dimensions: connectivity and enclosure / eyes on park. Weakest: edge activation (19.8). Border-vacuum risk is elevated (60). This score is a transparent reading of Jane Jacobs-style vitality factors, not a definitive judgment.
Area · 31.98 ha
Weighted across six dimensions · confidence 72%
Scores are not bell-curved. Percentiles and expected scores provide context without changing the underlying model.
Loading map…
The parks map is loading.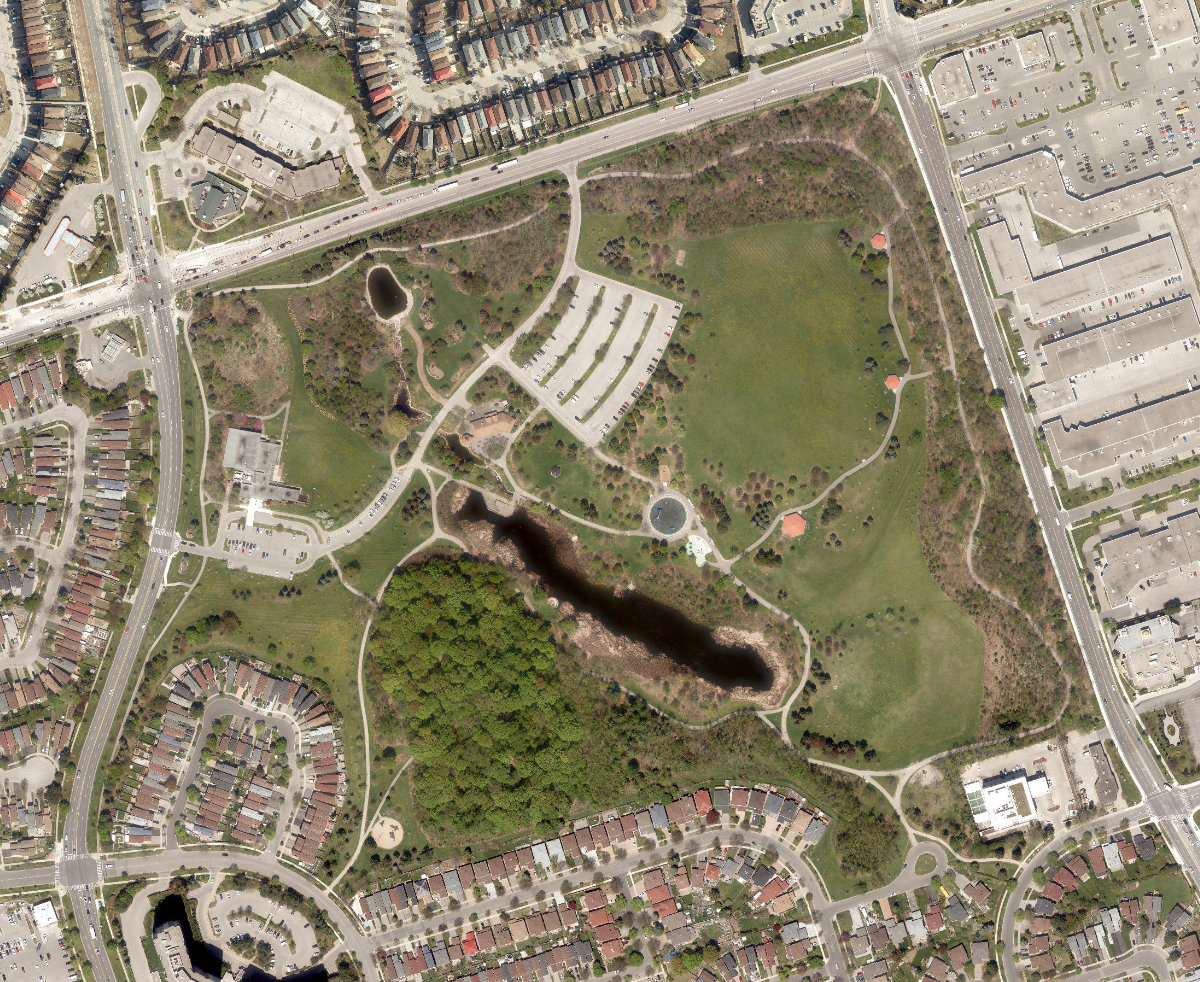
Explain this score
Where did the 46 come from? Each weighted contribution against a neutral 50 baseline. Green = pushed up; red = pulled down.
Sum of contributions = the headline score. A negative bar means that dimension dragged the park below the city-wide neutral baseline.
Why this park works
Milliken Park works because its connectivity score (80) is one of the city's strongest and its amenity diversity (39) is also top decile (34 transit stops sit within a 400 m walk; 26 intersections fall within 100 m of the edge).
What limits this park
Milliken Park is held back by enclosure (60, below-average); border-vacuum risk is also elevated (60).
Most distinctive characteristic
Most distinctive feature: exceptionally high connectivity (80, top decile).
Jacobs reading
Milliken Park sits between an urban social park and an ecological retreat: moderately useful for both, exceptionally suited to neither.
Tradeoffs
- Connectivity (80) significantly outpaces natural comfort (52): well placed in the city but offers little shade or ecological respite.
- High connectivity coexists with high border-vacuum risk (60): much of that connectivity is to highways, rail, or parking lots, not to neighbourhoods.
Performance in context
- This park is a strong overperformer for its cohort: raw 46 versus an expected 34 for similar parks (all Toronto parks) (gap +12).
- Citywide rank is high (91st) but typology rank is more modest (50th): the strength likely comes from the dataset average pulling lower than this typology’s baseline.
- Cohort is small (3273 parks). The gap shown here should be read with caution.
Typology classification
Classified as Destination Park: 32 ha, 5 amenity types, connectivity 80 / comfort 52. Secondary read: Waterfront Park (nearest waterbody within ~0 m).
Edge Activation
Within 100 m of the park edge: 31 active uses (transit_stop, community, retail, restaurant) and 8 dead/hostile uses (parking_lot). Active edges keep "eyes on the park" through the day; parking lots, blank institutional walls, rail and highway frontages drain street life.
Source: OSM POIs (amenity/shop) + Toronto Building Footprints + land use
Connectivity
Connectivity blends paths, intersections, transit, entrances, and edge density. This park has 77 mapped paths/walkways and 111 sidewalk segments within 50 m; 26 street intersections within 100 m; 34 transit stops within a 400 m walk; 16 estimated access points across ~2,964 m of perimeter. moderate edge density, small superblock penalty applied. Source coverage: centreline, pedestrian_network, transit_osm.
Source: Toronto Centreline V2 + Pedestrian Network + OSM transit stops
Amenity Diversity
5 distinct amenity types in the park (community_centre, fitness, picnic, playground, washroom). Diversity, not raw count, drives the score so a park with many distinct activity types can outrank a larger park that repeats the same use.
Source: Toronto Parks & Recreation Facilities + OSM amenity tags
Natural Comfort
Natural-comfort components for this park: 10.4% estimated tree canopy; 14.1% inside the ravine system; 4.2% water surface; 397 city-mapped trees inside the polygon (12.4/ha). Reading: water-cooled. Source coverage: treed_area, ravine, waterbodies, street_trees. Impervious surface is approximated (Toronto's authoritative layer ships only as a raster GeoTIFF).
Source: Toronto Treed Area + Ravine + Waterbodies + Street Tree Inventory
Enclosure / Eyes on Park
251 buildings within 25 m of the park edge (1 mid-rise, 250 low-rise, 0 tower); avg edge height 5.4 m (~2 floors); 8.5 buildings per 100 m of 2,964 m perimeter (strong frontage density); edges are barely there or single-storey; no towers immediately adjacent. "Eyes on the park" come strongest from the 1 mid-rise edge buildings.
Source: Toronto 3D Massing (building footprints + heights)
Border Vacuum Risk
Border-vacuum factors within 50 m of the park: parking_lot, parking_lot, parking_lot, parking_lot, parking_lot. Jacobs warned that highways, rail, parking lots and blank institutional edges act as "vacuums" that suppress foot traffic and isolate the park from its neighbourhood.
Source: Toronto Street Centreline (highways) + rail layer + OSM landuse + building footprints
Equity Context
Equity Context requires inputs not yet loaded for this park (Toronto Neighbourhood Profiles). Score is held at a neutral 50 with low confidence. Read with caution.
Source: Toronto Neighbourhood Profiles
Amenities (5 types · 5 records)
- community centre
- fitness
- picnic
- playground
- washroom
Nearby active-edge features (57)
- community: Milliken Park Community Recreation Centre0 m
- parking lot0 m
- parking lot0 m
- parking lot0 m
- transit stop: Middlefield Rd at Select Ave2 m
- transit stop: Steeles Avenue at Middlefield Road2 m
- transit stop3 m
- transit stop: McCowan Road at Steeles Avenue East3 m
- transit stop: 4325 McCowan Road5 m
- transit stop: Steeles Avenue at Opposite Walkway to Norm Crescent6 m
- transit stop20 m
- transit stop: Middlefield Rd at Select Ave21 m
- transit stop: Steeles Avenue at Walkway to Norm Crescent27 m
- transit stop: Middlefield Road at Steeles Avenue East28 m
- transit stop: McCowan Road at Walkway to Enchanted Hills Crescent29 m
- parking lot31 m
- transit stop: McCowan Road at Steeles Avenue East South Side31 m
- transit stop: McCowan Road at Alton Towers Circle North32 m
- parking lot33 m
- retail: Eros LED Lighting Inc - LED lighting & Electrical Supplies33 m
- transit stop: Steeles Avenue at McCowan Road34 m
- restaurant: New Da Fu Seafood Cuisine39 m
- retail: Best Way Carpet42 m
- restaurant: Sumilicious Smoked Meat - Deli45 m
- transit stop: McCowan Road at Alton Towers Circle North46 m
- retail: Shell Snack Shop50 m
- restaurant: Subway50 m
- transit stop: Steeles Avenue at McCowan Road52 m
- transit stop: Middlefield Road at Steeles Avenue East57 m
- transit stop: McCowan Road / Steeles Avenue58 m
- parking lot60 m
- parking lot64 m
- parking lot67 m
- transit stop: Steeles Avenue at Middlefield Road72 m
- restaurant: Jatujak Thai Restaurant76 m
- retail: Pasumai Market78 m
- transit stop: McCowan Road / Steeles Avenue79 m
- retail: SuperStop Express91 m
- restaurant: Pizzaville94 m
- parking lot102 m
- parking lot105 m
- transit stop: Middlefield Road at Steeles Avenue North Side105 m
- transit stop: Middlefield Rd at Ingleton Boulevard111 m
- restaurant: Nguyên Hương122 m
- parking lot125 m
- transit stop: Middlefield Rd at Passmore Avenue131 m
- parking lot134 m
- parking lot148 m
- parking lot149 m
- retail: Show Hair Salon150 m
- transit stop: McCowan Road Loop at Steeles Avenue151 m
- transit stop: McCowan Road at Miliken Wells Plaza159 m
- parking lot178 m
- restaurant: Ginger and Onion Cuisine182 m
- parking lot184 m
- parking lot188 m
- parking lot200 m
Park profile
Five-axis radar across the structural dimensions.
Citywide percentile ranks
Across all Toronto parks in the dataset.
- Overall vitality91th
- Edge activation78th
- Connectivity98th
- Amenity diversity98th
- Natural comfort64th
- Enclosure34th
Most similar parks
Closest in metric space across the five structural dimensions.
- Edithvale ParkCorridor / Linear Park49
- Smithfield ParkAthletic / Recreation Park49
- Woolner ParkParkette51
- Stan Wadlow ParkNeighbourhood Park52
- Bridlewood ParkAthletic / Recreation Park53
Most opposite parks
Furthest in metric space. Useful for recognising what kind of park this isn’t.
- Trca Lands ( 26)Ravine / Naturalized Park27
- Toronto Islands - Muggs Island ParkRavine / Naturalized Park25
- Rouge ParkRavine / Naturalized Park26
- Rouge ParkRavine / Naturalized Park21
- Rouge ParkRavine / Naturalized Park18
Human activity signals: not available
No activity signals have landed for this park yet. The model has scored its physical form but it can’t yet say how often it’s programmed, photographed, or walked through. See /data-ethics for what we will and will not collect.
Does this score feel accurate?
Your read of Milliken Parkmatters. We’re testing whether the model lines up with how people actually use the park. Submissions are stored locally; no account needed.
Tell us how this park feels
We measure structure (canopy, edges, connectivity). You measure feeling. Both matter, and disagreement is itself useful civic data.
What would improve this park?
Generated from the weakest measured dimensions: a starting point, not a prescription.
- Activate the edges: encourage cafés, retail or community uses on the streets that face the park; replace blank or parking-lot edges where possible.
- Diversify what people can do in the park (playground, washroom, water, shade, performance, sport, garden): even small additions raise this score.
- Mitigate border vacuums (highways, rail, parking) with active programming on the still-permeable edges and treat the hostile edge as a design challenge.
Data sources
- City of Toronto Open Data: Parks (Green Space)Polygon boundaries, official names, types.
- Parks & Recreation FacilitiesInventory of in-park amenities (washrooms, fields, rinks…).
- Toronto Pedestrian NetworkSidewalk segments around and through parks; estimated park entrances.
- Toronto Centreline V2Street segments + intersection nodes near park edges; trails and walkways.
- Toronto 3D MassingBuilding footprints + heights for edge-building counts, frontage density, and tower-in-the-park risk.
- Toronto Treed AreaTree canopy share inside park polygons via stratified-grid sampling.
- Toronto Waterbodies & RiversWater surface inside parks + nearest-water distance for cooling.
- Ravine & Natural Feature ProtectionRavine overlap as a cooling / natural-comfort signal.
- Toronto Street Tree InventoryTree count + density inside park polygons.
- Neighbourhood Profiles(Pending) Equity context proxy.
- OpenStreetMap (Overpass API)Cafés, restaurants, retail, transit stops, parking, highways, rail.