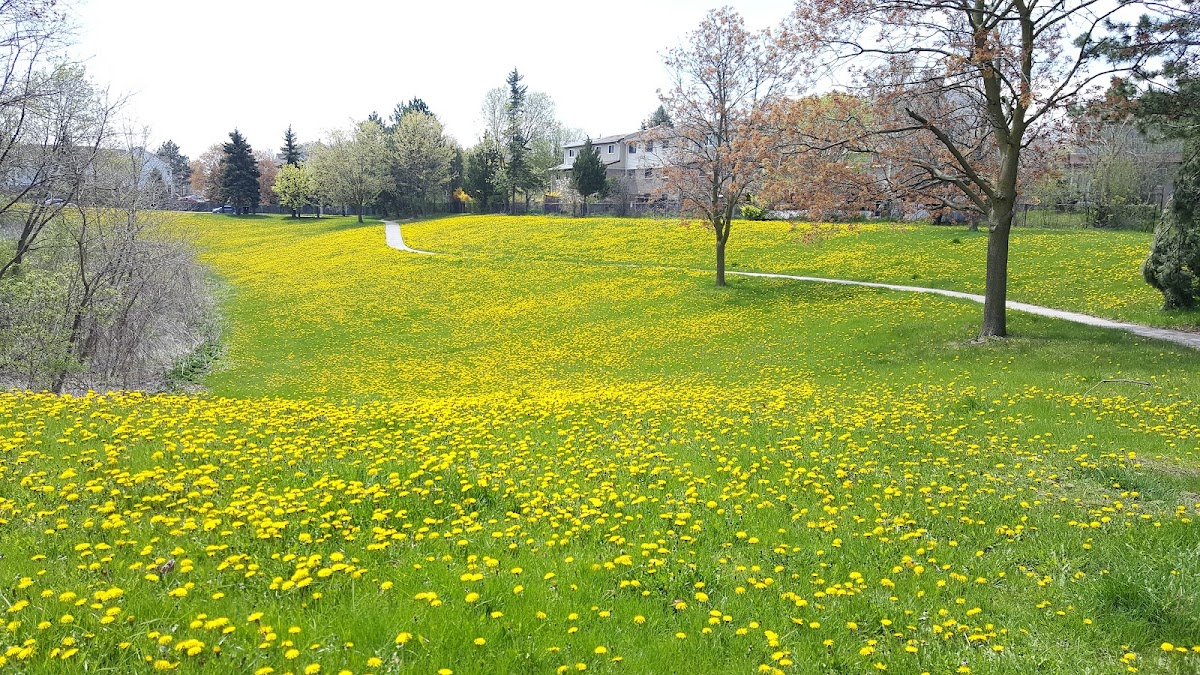
Malvern Woods
Ravine / Naturalized Park, one of the city's strongest overall (score 57, rank ~99th percentile). Strongest: natural comfort; weakest: enclosure.
Photo by dhilip bright ayydurai via Google Places · cached 5/9/2026
Malvern Woods scores 56.6 / 100. Strongest dimensions: natural comfort and connectivity. Weakest: amenity diversity (11.9). Border-vacuum risk is low. This score is a transparent reading of Jane Jacobs-style vitality factors, not a definitive judgment.
Area · 4.06 ha
Weighted across six dimensions · confidence 72%
Scores are not bell-curved. Percentiles and expected scores provide context without changing the underlying model.
Loading map…
The parks map is loading.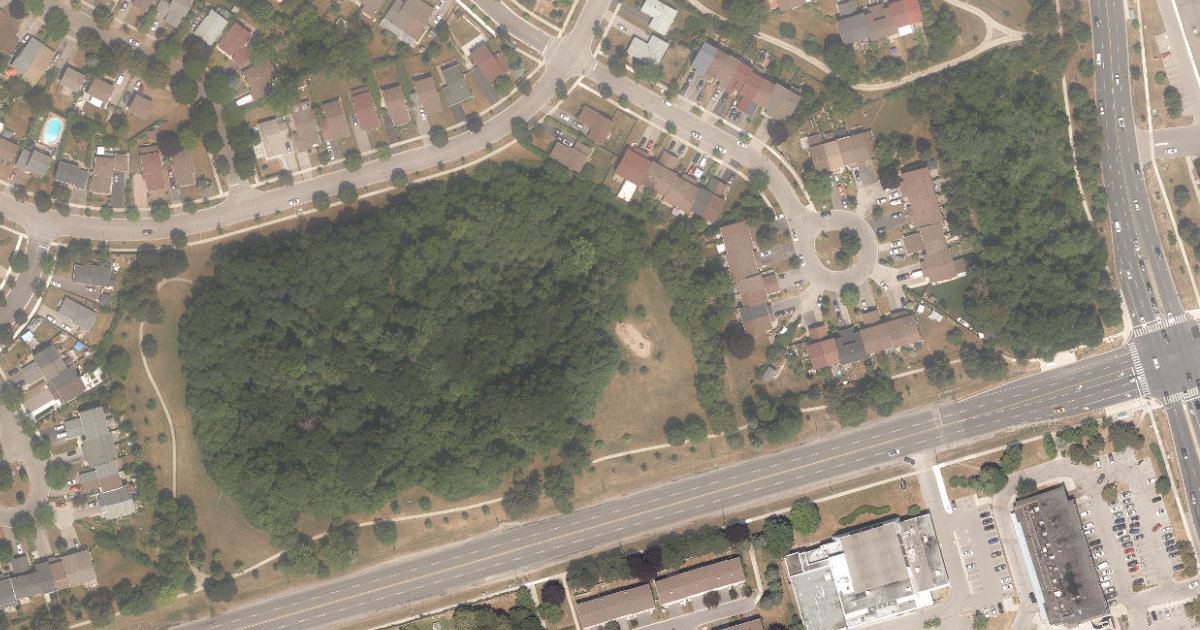
Explain this score
Where did the 57 come from? Each weighted contribution against a neutral 50 baseline. Green = pushed up; red = pulled down.
Sum of contributions = the headline score. A negative bar means that dimension dragged the park below the city-wide neutral baseline.
Why this park works
Malvern Woods works because its natural comfort score (87) is one of the city's strongest and its edge activation (46) is also top decile (66% tree canopy provides real shade; it sits inside the ravine system).
What limits this park
Malvern Woods is held back by enclosure (59, below-average).
Most distinctive characteristic
Most distinctive feature: exceptionally high natural comfort (87, top decile).
Jacobs reading
Malvern Woods sits between an urban social park and an ecological retreat: moderately useful for both, exceptionally suited to neither.
Performance in context
- This park is a strong overperformer for its cohort: raw 57 versus an expected 36 for similar parks (medium Ravine / Naturalized Park ravine) (gap +21).
Typology classification
Classified as Ravine / Naturalized Park: 57% ravine overlap, 66% canopy. Secondary read: Neighbourhood Park (4.1 ha, framed by 2 mid-rise vs 0 towers).
Edge Activation
Within 100 m of the park edge: 14 active uses (transit_stop, retail, restaurant, cafe) and 3 dead/hostile uses (parking_lot). Active edges keep "eyes on the park" through the day; parking lots, blank institutional walls, rail and highway frontages drain street life.
Source: OSM POIs (amenity/shop) + Toronto Building Footprints + land use
Connectivity
Connectivity blends paths, intersections, transit, entrances, and edge density. This park has 3 mapped paths/walkways and 41 sidewalk segments within 50 m; 13 street intersections within 100 m; 31 transit stops within a 400 m walk; 4 estimated access points across ~1,096 m of perimeter. low edge density, significant superblock penalty applied. Source coverage: centreline, pedestrian_network, transit_osm.
Source: Toronto Centreline V2 + Pedestrian Network + OSM transit stops
Amenity Diversity
1 distinct amenity types in the park (playground). Diversity, not raw count, drives the score so a park with many distinct activity types can outrank a larger park that repeats the same use.
Source: Toronto Parks & Recreation Facilities + OSM amenity tags
Natural Comfort
Natural-comfort components for this park: 65.8% estimated tree canopy; 56.8% inside the ravine system; nearest waterbody ~664 m; 7 city-mapped trees inside the polygon (1.7/ha). Reading: ravine-cooled. Source coverage: treed_area, ravine, waterbodies, street_trees. Impervious surface is approximated (Toronto's authoritative layer ships only as a raster GeoTIFF).
Source: Toronto Treed Area + Ravine + Waterbodies + Street Tree Inventory
Enclosure / Eyes on Park
67 buildings within 25 m of the park edge (2 mid-rise, 65 low-rise, 0 tower); avg edge height 5.2 m (~2 floors); 6.1 buildings per 100 m of 1,096 m perimeter (strong frontage density); edges are barely there or single-storey; no towers immediately adjacent. "Eyes on the park" come strongest from the 2 mid-rise edge buildings.
Source: Toronto 3D Massing (building footprints + heights)
Border Vacuum Risk
Park edges face the city. No significant border vacuum detected.
Source: Toronto Street Centreline (highways) + rail layer + OSM landuse + building footprints
Equity Context
Equity Context requires inputs not yet loaded for this park (Toronto Neighbourhood Profiles). Score is held at a neutral 50 with low confidence. Read with caution.
Source: Toronto Neighbourhood Profiles
Amenities (1 types · 1 records)
- playground
Nearby active-edge features (48)
- transit stop: Sheppard Avenue East13 m
- transit stop: Morningside Avenue16 m
- transit stop18 m
- transit stop36 m
- transit stop: 7731 Sheppard Avenue East41 m
- transit stop: Morningside Avenue44 m
- transit stop46 m
- parking lot54 m
- restaurant: Chubby's Sub65 m
- transit stop: Sheppard Avenue East70 m
- retail: Ken's Jewellery77 m
- retail: BK Variety82 m
- retail: Lee Valley85 m
- retail: Circle K91 m
- parking lot94 m
- parking lot95 m
- cafe: Tim Hortons96 m
- restaurant: Fuego's Halal Kitchen109 m
- restaurant: Subway114 m
- transit stop116 m
- parking lot123 m
- restaurant: Chick-N-Joy125 m
- parking lot125 m
- transit stop: Foregate Avenue126 m
- parking lot132 m
- parking lot138 m
- parking lot141 m
- transit stop: Beckon Gate at Sheppard Avenue E145 m
- parking lot145 m
- transit stop: Foregate Avenue146 m
- transit stop: Beckon Gate at Sheppard Avenue E154 m
- parking lot159 m
- retail: Malana Spa160 m
- cafe: Tim Hortons164 m
- transit stop: Murison Blvd at Usherwood Court164 m
- transit stop: Milner Ave at Cinemart Dr169 m
- parking lot174 m
- restaurant: Wendy's175 m
- retail: Fusion Supermarket177 m
- transit stop: Shepppard Ave E at Brenyon Way179 m
- restaurant: World Famous Pizza180 m
- parking lot182 m
- parking lot182 m
- retail: Urban Silks191 m
- parking lot192 m
- transit stop: Brenyon Way193 m
- retail: Rouge Bakery196 m
- transit stop: Morningside SB/Sheppard197 m
Park profile
Five-axis radar across the structural dimensions.
Citywide percentile ranks
Across all Toronto parks in the dataset.
- Overall vitality99th
- Edge activation95th
- Connectivity89th
- Amenity diversity75th
- Natural comfort96th
- Enclosure31th
Most similar parks
Closest in metric space across the five structural dimensions.
- Curran Hall Ravine ParkWaterfront Park52
- Derrydowns ParkWaterfront Park51
- Murison ParkRavine / Naturalized Park54
- Guild Park And GardensRavine / Naturalized Park51
- Lower Highland CreekRavine / Naturalized Park50
Most opposite parks
Furthest in metric space. Useful for recognising what kind of park this isn’t.
- Rouge ParkRavine / Naturalized Park18
- Trca Lands ( 58)Waterfront Park18
- Etobicoke Hydro Green SpaceOther20
- Scarborough Hydro Green SpaceOther20
- Rouge ParkCorridor / Linear Park20
Visitor signals
Public attention measured by Google Places aggregates. This proxies attention, not occupancy. Aggregate-only: no usernames, no review text, no extra photos beyond the cached hero.
p10 citywide · p12 within Ravine / Naturalized Park
Source: Google Places API · match unverified (0.00 composite confidence) · last refreshed 5/9/2026. Privacy contract. Measures public attention, not occupancy.
Human activity signals: not available
No activity signals have landed for this park yet. The model has scored its physical form but it can’t yet say how often it’s programmed, photographed, or walked through. See /data-ethics for what we will and will not collect.
Does this score feel accurate?
Your read of Malvern Woodsmatters. We’re testing whether the model lines up with how people actually use the park. Submissions are stored locally; no account needed.
Tell us how this park feels
We measure structure (canopy, edges, connectivity). You measure feeling. Both matter, and disagreement is itself useful civic data.
What would improve this park?
Generated from the weakest measured dimensions: a starting point, not a prescription.
- Activate the edges: encourage cafés, retail or community uses on the streets that face the park; replace blank or parking-lot edges where possible.
- Diversify what people can do in the park (playground, washroom, water, shade, performance, sport, garden): even small additions raise this score.
Data sources
- City of Toronto Open Data: Parks (Green Space)Polygon boundaries, official names, types.
- Parks & Recreation FacilitiesInventory of in-park amenities (washrooms, fields, rinks…).
- Toronto Pedestrian NetworkSidewalk segments around and through parks; estimated park entrances.
- Toronto Centreline V2Street segments + intersection nodes near park edges; trails and walkways.
- Toronto 3D MassingBuilding footprints + heights for edge-building counts, frontage density, and tower-in-the-park risk.
- Toronto Treed AreaTree canopy share inside park polygons via stratified-grid sampling.
- Toronto Waterbodies & RiversWater surface inside parks + nearest-water distance for cooling.
- Ravine & Natural Feature ProtectionRavine overlap as a cooling / natural-comfort signal.
- Toronto Street Tree InventoryTree count + density inside park polygons.
- Neighbourhood Profiles(Pending) Equity context proxy.
- OpenStreetMap (Overpass API)Cafés, restaurants, retail, transit stops, parking, highways, rail.