Mimico Waterfront Park
Waterfront Park, below average overall (score 27, rank ~20th percentile). Strongest: enclosure; weakest: edge activation.
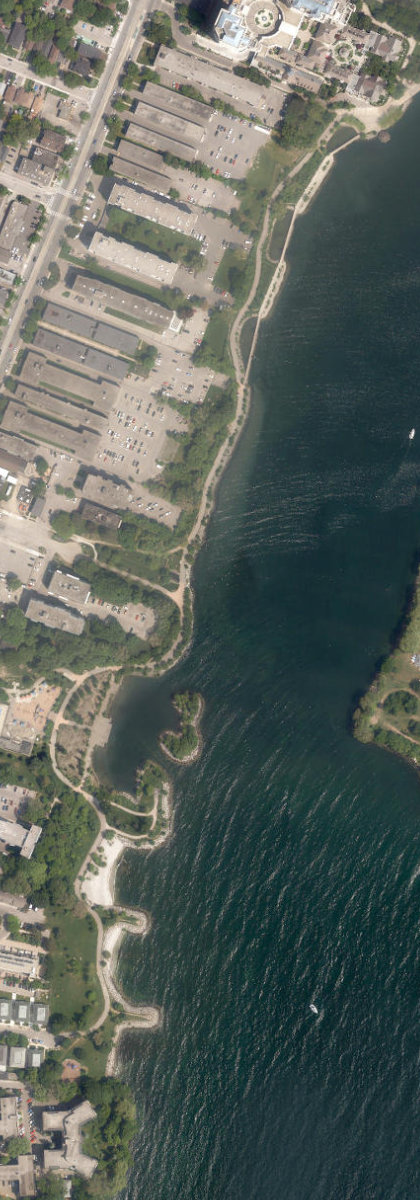
Aerial, City of Toronto orthophoto, ~8 cm/px source · cached 5/9/2026
Mimico Waterfront Park scores 27.4 / 100. Strongest dimensions: enclosure / eyes on park and connectivity. Weakest: edge activation (0). Border-vacuum risk is elevated (100). This score is a transparent reading of Jane Jacobs-style vitality factors, not a definitive judgment.
Area · 4.14 ha
Weighted across six dimensions · confidence 68%
Scores are not bell-curved. Percentiles and expected scores provide context without changing the underlying model.
Loading map…
The parks map is loading.Explain this score
Where did the 27 come from? Each weighted contribution against a neutral 50 baseline. Green = pushed up; red = pulled down.
Sum of contributions = the headline score. A negative bar means that dimension dragged the park below the city-wide neutral baseline.
Why this park works
Mimico Waterfront Park works because its enclosure score (74) is above average and its amenity diversity (12) is also above-average (42 mid-rise buildings frame the edge with passive surveillance).
What limits this park
Mimico Waterfront Park is held back by edge activation (0, below-average): the surrounding streets carry too few active uses to spill into the park; border-vacuum risk is also elevated (100).
Most distinctive characteristic
Most distinctive feature: exceptionally high enclosure (74, above-average).
Jacobs reading
Mimico Waterfront Park sits between an urban social park and an ecological retreat: moderately useful for both, exceptionally suited to neither.
Tradeoffs
- The park is enclosed by buildings (74) but the surrounding streets are quiet (edge activation 0): frame without animation.
- 13 nearby towers cast wind and shadow without contributing canopy: passive surveillance is plentiful but human-scale comfort is not.
Typology classification
Classified as Waterfront Park: 11% water surface inside park. Secondary read: Corridor / Linear Park (shape elongation 3.4× a circle of equal area).
Edge Activation
Within 100 m of the park edge: 2 active uses (restaurant, retail) and 25 dead/hostile uses (parking_lot). Active edges keep "eyes on the park" through the day; parking lots, blank institutional walls, rail and highway frontages drain street life.
Source: OSM POIs (amenity/shop) + Toronto Building Footprints + land use
Connectivity
Connectivity blends paths, intersections, transit, entrances, and edge density. This park has 38 mapped paths/walkways and 27 sidewalk segments within 50 m; 4 street intersections within 100 m; 19 transit stops within a 400 m walk; 11 estimated access points across ~2,462 m of perimeter. low edge density, significant superblock penalty applied. Source coverage: centreline, pedestrian_network, transit_osm.
Source: Toronto Centreline V2 + Pedestrian Network + OSM transit stops
Amenity Diversity
1 distinct amenity types in the park (playground). Diversity, not raw count, drives the score so a park with many distinct activity types can outrank a larger park that repeats the same use.
Source: Toronto Parks & Recreation Facilities + OSM amenity tags
Natural Comfort
Natural-comfort components for this park: ~1.0% effective canopy (0.0% from contiguous tree polygons + scattered tree density); 1.6% inside the ravine system; 11.1% water surface; 6 city-mapped trees inside the polygon (1.4/ha). Reading: water-cooled. Source coverage: ravine, waterbodies, street_trees. Impervious surface is approximated (Toronto's authoritative layer ships only as a raster GeoTIFF).
Source: Toronto Treed Area + Ravine + Waterbodies + Street Tree Inventory
Enclosure / Eyes on Park
80 buildings within 25 m of the park edge (42 mid-rise, 25 low-rise, 13 tower); avg edge height 19.5 m (~7 floors); 3.3 buildings per 100 m of 2,462 m perimeter (strong frontage density); edges are at a Jacobs-scale walkable mid-rise (3 to 7 floors); 13 towers ≥ 40 m within 25 m of the edge. "Eyes on the park" come strongest from the 42 mid-rise edge buildings.
Source: Toronto 3D Massing (building footprints + heights)
Border Vacuum Risk
Border-vacuum factors within 50 m of the park: parking_lot, parking_lot, parking_lot, parking_lot, parking_lot, parking_lot, parking_lot, parking_lot, parking_lot, parking_lot, parking_lot. Jacobs warned that highways, rail, parking lots and blank institutional edges act as "vacuums" that suppress foot traffic and isolate the park from its neighbourhood.
Source: Toronto Street Centreline (highways) + rail layer + OSM landuse + building footprints
Equity Context
Equity Context requires inputs not yet loaded for this park (Toronto Neighbourhood Profiles). Score is held at a neutral 50 with low confidence. Read with caution.
Source: Toronto Neighbourhood Profiles
Amenities (1 types · 1 records)
- playground
Nearby active-edge features (80)
- parking lot5 m
- parking lot10 m
- parking lot17 m
- parking lot24 m
- parking lot26 m
- parking lot28 m
- parking lot37 m
- parking lot40 m
- parking lot43 m
- parking lot44 m
- parking lot48 m
- parking lot54 m
- parking lot58 m
- parking lot59 m
- parking lot68 m
- parking lot69 m
- parking lot71 m
- parking lot81 m
- parking lot81 m
- parking lot81 m
- parking lot85 m
- parking lot90 m
- parking lot90 m
- restaurant: Nimman91 m
- parking lot99 m
- parking lot100 m
- retail: Freedom Mobile100 m
- parking lot101 m
- retail: BooBoo Pet Grooming Serices103 m
- parking lot104 m
- parking lot106 m
- parking lot108 m
- parking lot111 m
- retail: Gud Daae gluten free sandwiches112 m
- parking lot117 m
- retail: Coin Laundry118 m
- parking lot118 m
- parking lot120 m
- parking lot122 m
- parking lot123 m
- parking lot128 m
- parking lot128 m
- parking lot129 m
- parking lot130 m
- parking lot131 m
- parking lot136 m
- restaurant: Maurya East Indian Roti Cuisine137 m
- retail: International Hair Salon137 m
- retail137 m
- retail: Money Shop140 m
- restaurant: Mangoes140 m
- retail: Jac's Milk142 m
- restaurant: Kothur143 m
- restaurant: Mixi Culinary Project144 m
- retail: Glow Body Tans & Spa145 m
- retail: Broke Billonares145 m
- retail: XL Laundromat & Dry Cleaners147 m
- parking lot147 m
- parking lot150 m
- transit stop: Mimico Avenue152 m
- parking lot152 m
- parking lot152 m
- transit stop: Mimico Avenue154 m
- parking lot156 m
- highway: Lake Shore Boulevard West158 m
- transit stop: Burlington Street161 m
- transit stop: Mimico Avenue161 m
- parking lot162 m
- transit stop: Louisa Street164 m
- parking lot168 m
- restaurant: Pearl Sushi169 m
- transit stop: Burlington Street170 m
- transit stop: Burlington Street170 m
- highway: Lake Shore Boulevard West170 m
- parking lot170 m
- parking lot170 m
- transit stop: Louisa Street171 m
- retail: Tammy's Spaw173 m
- retail: Chatr173 m
- parking lot173 m
Park profile
Five-axis radar across the structural dimensions.
Citywide percentile ranks
Across all Toronto parks in the dataset.
- Overall vitality20th
- Edge activation30th
- Connectivity74th
- Amenity diversity74th
- Natural comfort32th
- Enclosure75th
Most similar parks
Closest in metric space across the five structural dimensions.
- Gamble ParkUrban Plaza38
- Aldwych ParkUrban Plaza37
- Benner ParkOther28
- DON MILLS MIDDLE SCHOOL - Building GroundsNeighbourhood Park34
- THE NEW GENERATION YOUTH RECREATION CENTRE - Building GroundsNeighbourhood Park29
Most opposite parks
Furthest in metric space. Useful for recognising what kind of park this isn’t.
- Market Lane ParkUrban Plaza63
- Kew GardensNeighbourhood Park71
- Mclevin Woods ParkRavine / Naturalized Park49
- Leslie Grove ParkParkette68
- Trca Lands ( 26)Ravine / Naturalized Park27
Human activity signals: not available
No activity signals have landed for this park yet. The model has scored its physical form but it can’t yet say how often it’s programmed, photographed, or walked through. See /data-ethics for what we will and will not collect.
Does this score feel accurate?
Your read of Mimico Waterfront Parkmatters. We’re testing whether the model lines up with how people actually use the park. Submissions are stored locally; no account needed.
Tell us how this park feels
We measure structure (canopy, edges, connectivity). You measure feeling. Both matter, and disagreement is itself useful civic data.
What would improve this park?
Generated from the weakest measured dimensions: a starting point, not a prescription.
- Activate the edges: encourage cafés, retail or community uses on the streets that face the park; replace blank or parking-lot edges where possible.
- Diversify what people can do in the park (playground, washroom, water, shade, performance, sport, garden): even small additions raise this score.
- Increase canopy and reduce paved area. Shade and water features extend usable hours and seasons.
- Mitigate border vacuums (highways, rail, parking) with active programming on the still-permeable edges and treat the hostile edge as a design challenge.
Data sources
- City of Toronto Open Data: Parks (Green Space)Polygon boundaries, official names, types.
- Parks & Recreation FacilitiesInventory of in-park amenities (washrooms, fields, rinks…).
- Toronto Pedestrian NetworkSidewalk segments around and through parks; estimated park entrances.
- Toronto Centreline V2Street segments + intersection nodes near park edges; trails and walkways.
- Toronto 3D MassingBuilding footprints + heights for edge-building counts, frontage density, and tower-in-the-park risk.
- Toronto Treed AreaTree canopy share inside park polygons via stratified-grid sampling.
- Toronto Waterbodies & RiversWater surface inside parks + nearest-water distance for cooling.
- Ravine & Natural Feature ProtectionRavine overlap as a cooling / natural-comfort signal.
- Toronto Street Tree InventoryTree count + density inside park polygons.
- Neighbourhood Profiles(Pending) Equity context proxy.
- OpenStreetMap (Overpass API)Cafés, restaurants, retail, transit stops, parking, highways, rail.