David A. Balfour Park
Ravine / Naturalized Park, above average overall (score 39, rank ~72th percentile). Strongest: connectivity; weakest: edge activation.
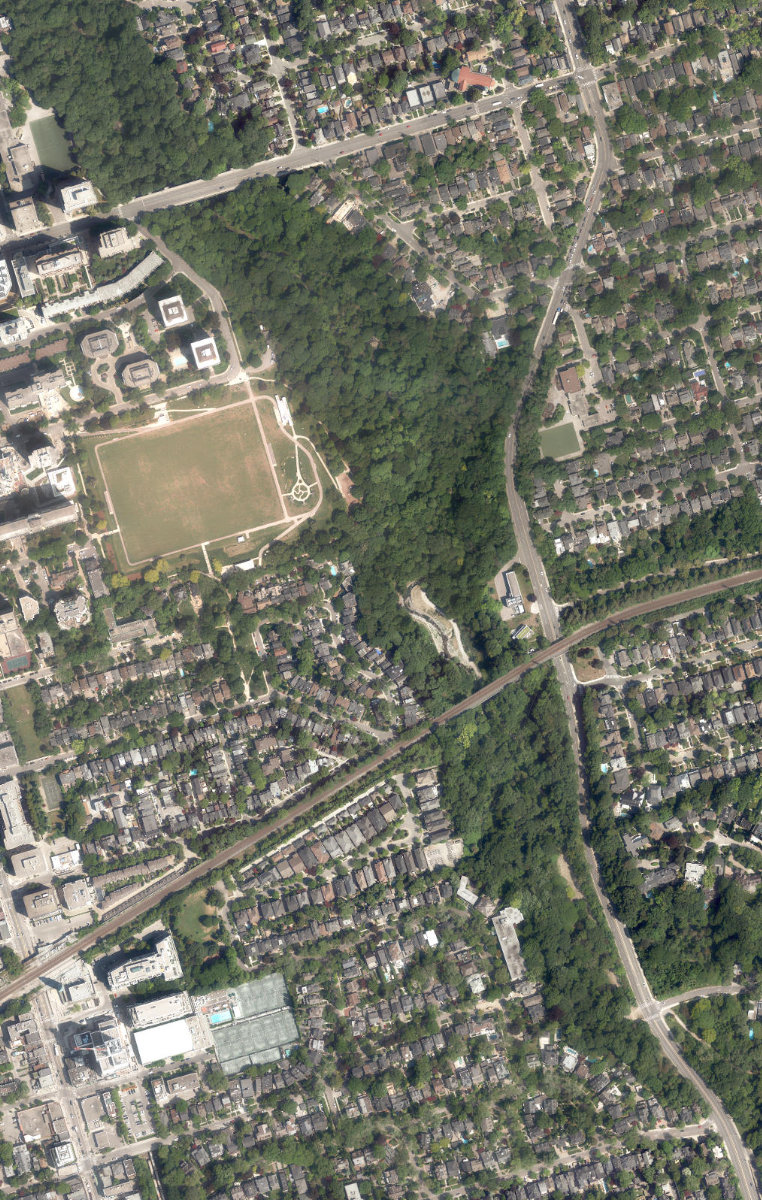
Aerial, City of Toronto orthophoto, ~8 cm/px source · cached 5/9/2026
David A. Balfour Park scores 39.4 / 100. Strongest dimensions: enclosure / eyes on park and connectivity. Weakest: edge activation (0). Border-vacuum risk is elevated (100). This score is a transparent reading of Jane Jacobs-style vitality factors, not a definitive judgment.
Area · 21.27 ha
Weighted across six dimensions · confidence 72%
Scores are not bell-curved. Percentiles and expected scores provide context without changing the underlying model.
Loading map…
The parks map is loading.Explain this score
Where did the 39 come from? Each weighted contribution against a neutral 50 baseline. Green = pushed up; red = pulled down.
Sum of contributions = the headline score. A negative bar means that dimension dragged the park below the city-wide neutral baseline.
Why this park works
David A. Balfour Park works because its connectivity score (84) is one of the city's strongest and its enclosure (84) is also top quartile (45 transit stops sit within a 400 m walk; 52 intersections fall within 100 m of the edge).
What limits this park
David A. Balfour Park is held back by edge activation (0, below-average): the surrounding streets carry too few active uses to spill into the park; border-vacuum risk is also elevated (100).
Most distinctive characteristic
Most distinctive feature: exceptionally high connectivity (84, top decile).
Jacobs reading
David A. Balfour Park sits between an urban social park and an ecological retreat: moderately useful for both, exceptionally suited to neither.
Tradeoffs
- The park is enclosed by buildings (84) but the surrounding streets are quiet (edge activation 0): frame without animation.
- High connectivity coexists with high border-vacuum risk (100): much of that connectivity is to highways, rail, or parking lots, not to neighbourhoods.
Typology classification
Classified as Ravine / Naturalized Park: 70% ravine overlap, 23% canopy. Secondary read: Waterfront Park (nearest waterbody within ~0 m).
Edge Activation
Within 100 m of the park edge: 11 active uses (retail, restaurant, transit_stop) and 12 dead/hostile uses (parking_lot, rail). Active edges keep "eyes on the park" through the day; parking lots, blank institutional walls, rail and highway frontages drain street life.
Source: OSM POIs (amenity/shop) + Toronto Building Footprints + land use
Connectivity
Connectivity blends paths, intersections, transit, entrances, and edge density. This park has 98 mapped paths/walkways and 101 sidewalk segments within 50 m; 52 street intersections within 100 m; 45 transit stops within a 400 m walk; 34 estimated access points across ~4,312 m of perimeter. moderate edge density, small superblock penalty applied. Source coverage: centreline, pedestrian_network, transit_osm.
Source: Toronto Centreline V2 + Pedestrian Network + OSM transit stops
Amenity Diversity
2 distinct amenity types in the park (playground, washroom). Diversity, not raw count, drives the score so a park with many distinct activity types can outrank a larger park that repeats the same use.
Source: Toronto Parks & Recreation Facilities + OSM amenity tags
Natural Comfort
Natural-comfort components for this park: 23.1% estimated tree canopy; 70.2% inside the ravine system; 2.9% water surface; 71 city-mapped trees inside the polygon (3.3/ha). Reading: ravine-cooled. Source coverage: treed_area, ravine, waterbodies, street_trees. Impervious surface is approximated (Toronto's authoritative layer ships only as a raster GeoTIFF).
Source: Toronto Treed Area + Ravine + Waterbodies + Street Tree Inventory
Enclosure / Eyes on Park
324 buildings within 25 m of the park edge (111 mid-rise, 190 low-rise, 23 tower); avg edge height 13.3 m (~4 floors); 7.5 buildings per 100 m of 4,312 m perimeter (strong frontage density); edges are at a Jacobs-scale walkable mid-rise (3 to 7 floors); 23 towers ≥ 40 m within 25 m of the edge. "Eyes on the park" come strongest from the 111 mid-rise edge buildings.
Source: Toronto 3D Massing (building footprints + heights)
Border Vacuum Risk
Border-vacuum factors within 50 m of the park: parking_lot, North Toronto Subdivision, North Toronto Subdivision, North Toronto Subdivision, North Toronto Subdivision, North Toronto Subdivision, North Toronto Subdivision. Jacobs warned that highways, rail, parking lots and blank institutional edges act as "vacuums" that suppress foot traffic and isolate the park from its neighbourhood.
Source: Toronto Street Centreline (highways) + rail layer + OSM landuse + building footprints
Equity Context
Equity Context requires inputs not yet loaded for this park (Toronto Neighbourhood Profiles). Score is held at a neutral 50 with low confidence. Read with caution.
Source: Toronto Neighbourhood Profiles
Amenities (2 types · 2 records)
- playground
- washroom
Nearby active-edge features (60)
- rail: North Toronto Subdivision6 m
- rail: North Toronto Subdivision10 m
- transit stop: Avoca Avenue14 m
- rail: North Toronto Subdivision16 m
- rail: North Toronto Subdivision18 m
- transit stop: Avoca Avenue22 m
- rail: North Toronto Subdivision24 m
- rail: North Toronto Subdivision27 m
- parking lot32 m
- parking lot66 m
- parking lot72 m
- retail: Wine Rack79 m
- parking lot85 m
- retail: Farm Boy86 m
- parking lot86 m
- transit stop90 m
- restaurant: Twisted Indian Wraps91 m
- parking lot93 m
- retail: Skin society bar94 m
- retail: Wine Rack97 m
- retail: Ava Pharmacy98 m
- retail: Towne Dry Cleaners98 m
- retail: Forest Spa100 m
- transit stop: Inglewood Drive110 m
- parking lot113 m
- transit stop: Inglewood Drive115 m
- parking lot135 m
- rail139 m
- rail139 m
- retail: Hearing Solutions143 m
- parking lot143 m
- parking lot: Toronto Parking Authority144 m
- parking lot150 m
- restaurant: Kofuko Sushi151 m
- parking lot154 m
- retail: The Top Knot155 m
- rail: North Toronto Subdivision155 m
- restaurant: Megumi Mazesoba157 m
- rail: North Toronto Subdivision159 m
- parking lot162 m
- transit stop: South Drive162 m
- transit stop: St. Clair Station166 m
- retail: Northern Artists ProLab166 m
- parking lot167 m
- transit stop: St. Clair Station168 m
- transit stop: St. Clair Station177 m
- retail: Class One Dry Cleaners181 m
- transit stop: South Drive182 m
- parking lot186 m
- parking lot: City of Toronto Reserved Parking188 m
- transit stop: St. Clair Station188 m
- retail: The Chocolate Tulip188 m
- parking lot189 m
- restaurant: Brownes Bistro194 m
- retail194 m
- retail: Blowdry Lounge196 m
- retail: i.D. Eyewear196 m
- retail: The Ten Spot196 m
- retail: The UPS Store198 m
- transit stop: St. Clair200 m
Park profile
Five-axis radar across the structural dimensions.
Citywide percentile ranks
Across all Toronto parks in the dataset.
- Overall vitality72th
- Edge activation30th
- Connectivity100th
- Amenity diversity87th
- Natural comfort81th
- Enclosure90th
Most similar parks
Closest in metric space across the five structural dimensions.
- Brookdale ParkRavine / Naturalized Park43
- Lawrence Park RavineRavine / Naturalized Park41
- Joseph Bannon ParkParkette46
- Sanwood ParkNeighbourhood Park45
- Michael Power ParkParkette40
Most opposite parks
Furthest in metric space. Useful for recognising what kind of park this isn’t.
- Rouge ParkRavine / Naturalized Park18
- Trca Lands ( 58)Waterfront Park18
- Rouge ParkRavine / Naturalized Park21
- Queen'S Quay Traffic IslandWaterfront Park49
- Toronto Islands - Muggs Island ParkRavine / Naturalized Park25
Human activity signals: not available
No activity signals have landed for this park yet. The model has scored its physical form but it can’t yet say how often it’s programmed, photographed, or walked through. See /data-ethics for what we will and will not collect.
Does this score feel accurate?
Your read of David A. Balfour Parkmatters. We’re testing whether the model lines up with how people actually use the park. Submissions are stored locally; no account needed.
Tell us how this park feels
We measure structure (canopy, edges, connectivity). You measure feeling. Both matter, and disagreement is itself useful civic data.
What would improve this park?
Generated from the weakest measured dimensions: a starting point, not a prescription.
- Activate the edges: encourage cafés, retail or community uses on the streets that face the park; replace blank or parking-lot edges where possible.
- Diversify what people can do in the park (playground, washroom, water, shade, performance, sport, garden): even small additions raise this score.
- Mitigate border vacuums (highways, rail, parking) with active programming on the still-permeable edges and treat the hostile edge as a design challenge.
Data sources
- City of Toronto Open Data: Parks (Green Space)Polygon boundaries, official names, types.
- Parks & Recreation FacilitiesInventory of in-park amenities (washrooms, fields, rinks…).
- Toronto Pedestrian NetworkSidewalk segments around and through parks; estimated park entrances.
- Toronto Centreline V2Street segments + intersection nodes near park edges; trails and walkways.
- Toronto 3D MassingBuilding footprints + heights for edge-building counts, frontage density, and tower-in-the-park risk.
- Toronto Treed AreaTree canopy share inside park polygons via stratified-grid sampling.
- Toronto Waterbodies & RiversWater surface inside parks + nearest-water distance for cooling.
- Ravine & Natural Feature ProtectionRavine overlap as a cooling / natural-comfort signal.
- Toronto Street Tree InventoryTree count + density inside park polygons.
- Neighbourhood Profiles(Pending) Equity context proxy.
- OpenStreetMap (Overpass API)Cafés, restaurants, retail, transit stops, parking, highways, rail.