G. Ross Lord Park
Waterfront Park, above average overall (score 39, rank ~71th percentile). Strongest: amenity diversity; weakest: edge activation.
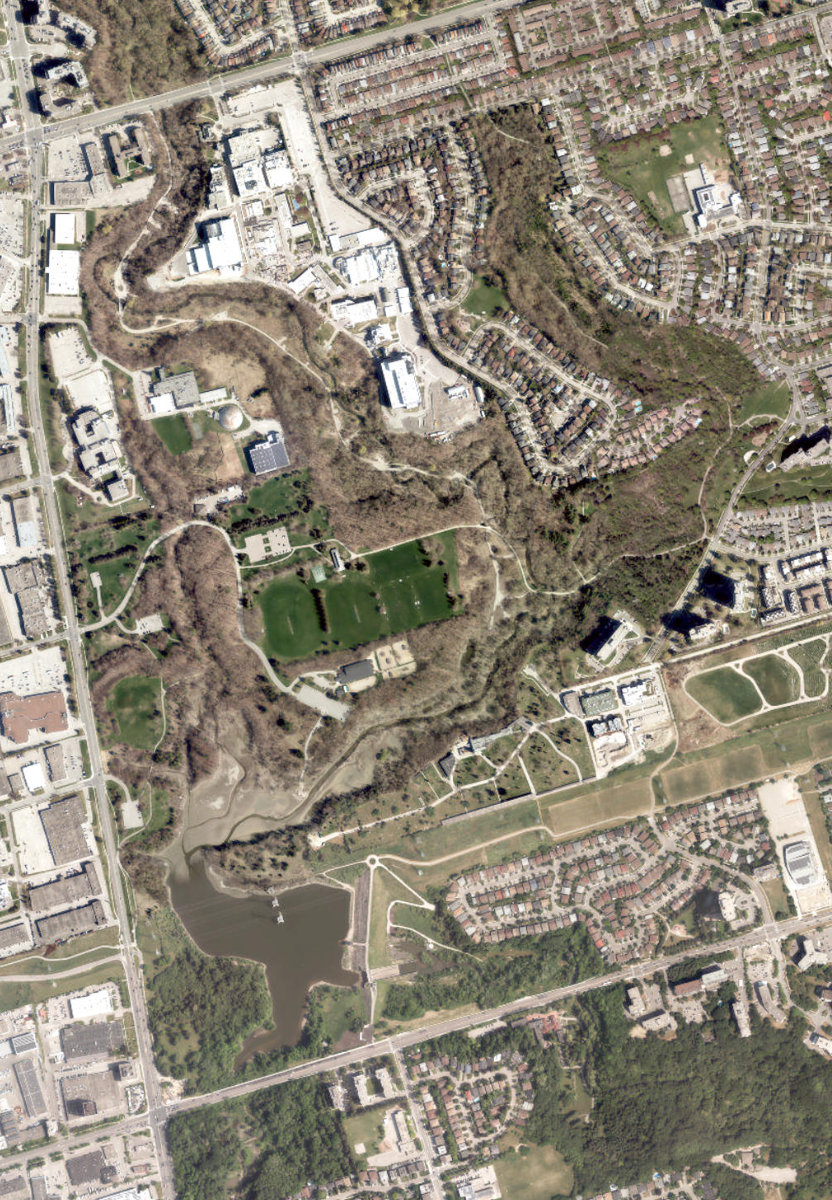
Aerial, City of Toronto orthophoto, ~8 cm/px source · cached 5/9/2026
G. Ross Lord Park scores 39.1 / 100. Strongest dimensions: natural comfort and connectivity. Weakest: edge activation (0). Border-vacuum risk is elevated (100). This score is a transparent reading of Jane Jacobs-style vitality factors, not a definitive judgment.
Area · 136.85 ha
Weighted across six dimensions · confidence 72%
Scores are not bell-curved. Percentiles and expected scores provide context without changing the underlying model.
Loading map…
The parks map is loading.Explain this score
Where did the 39 come from? Each weighted contribution against a neutral 50 baseline. Green = pushed up; red = pulled down.
Sum of contributions = the headline score. A negative bar means that dimension dragged the park below the city-wide neutral baseline.
Why this park works
G. Ross Lord Park works because its amenity diversity score (35) is one of the city's strongest and its connectivity (74) is also top decile.
What limits this park
G. Ross Lord Park is held back by edge activation (0, bottom quartile): the surrounding streets carry too few active uses to spill into the park; border-vacuum risk is also elevated (100).
Most distinctive characteristic
Most distinctive feature: exceptionally high amenity diversity (35, top decile).
Jacobs reading
G. Ross Lord Park sits between an urban social park and an ecological retreat: moderately useful for both, exceptionally suited to neither.
Tradeoffs
- The park is enclosed by buildings (62) but the surrounding streets are quiet (edge activation 0): frame without animation.
- High connectivity coexists with high border-vacuum risk (100): much of that connectivity is to highways, rail, or parking lots, not to neighbourhoods.
Typology classification
Classified as Waterfront Park: 22% water surface inside park. Secondary read: Ravine / Naturalized Park (85% ravine overlap, 28% canopy).
Edge Activation
Within 100 m of the park edge: 33 active uses (restaurant, retail, transit_stop) and 33 dead/hostile uses (parking_lot). Active edges keep "eyes on the park" through the day; parking lots, blank institutional walls, rail and highway frontages drain street life.
Source: OSM POIs (amenity/shop) + Toronto Building Footprints + land use
Connectivity
Connectivity blends paths, intersections, transit, entrances, and edge density. This park has 57 mapped paths/walkways and 184 sidewalk segments within 50 m; 40 street intersections within 100 m; 56 transit stops within a 400 m walk; 20 estimated access points across ~11,227 m of perimeter. low edge density, significant superblock penalty applied. Source coverage: centreline, pedestrian_network, transit_osm.
Source: Toronto Centreline V2 + Pedestrian Network + OSM transit stops
Amenity Diversity
4 distinct amenity types in the park (dog_area, picnic, sports_field, washroom). Diversity, not raw count, drives the score so a park with many distinct activity types can outrank a larger park that repeats the same use.
Source: Toronto Parks & Recreation Facilities + OSM amenity tags
Natural Comfort
Natural-comfort components for this park: 27.6% estimated tree canopy; 84.6% inside the ravine system; 21.8% water surface; 265 city-mapped trees inside the polygon (1.9/ha). Reading: ravine-cooled. Source coverage: treed_area, ravine, waterbodies, street_trees. Impervious surface is approximated (Toronto's authoritative layer ships only as a raster GeoTIFF).
Source: Toronto Treed Area + Ravine + Waterbodies + Street Tree Inventory
Enclosure / Eyes on Park
476 buildings within 25 m of the park edge (27 mid-rise, 442 low-rise, 7 tower); avg edge height 7.2 m (~2 floors); 4.2 buildings per 100 m of 11,227 m perimeter (strong frontage density); edges are low-rise (mostly 2 to 3 floors); 7 towers ≥ 40 m within 25 m of the edge. "Eyes on the park" come strongest from the 27 mid-rise edge buildings.
Source: Toronto 3D Massing (building footprints + heights)
Border Vacuum Risk
Border-vacuum factors within 50 m of the park: parking_lot, parking_lot, parking_lot, parking_lot, parking_lot, parking_lot, parking_lot, parking_lot, parking_lot, parking_lot, parking_lot, parking_lot, parking_lot, parking_lot, parking_lot, parking_lot, parking_lot, parking_lot. Jacobs warned that highways, rail, parking lots and blank institutional edges act as "vacuums" that suppress foot traffic and isolate the park from its neighbourhood.
Source: Toronto Street Centreline (highways) + rail layer + OSM landuse + building footprints
Equity Context
Equity Context requires inputs not yet loaded for this park (Toronto Neighbourhood Profiles). Score is held at a neutral 50 with low confidence. Read with caution.
Source: Toronto Neighbourhood Profiles
Amenities (4 types · 4 records)
- dog area
- picnic
- sports field
- washroom
Nearby active-edge features (80)
- parking lot0 m
- parking lot0 m
- parking lot0 m
- parking lot0 m
- parking lot0 m
- parking lot0 m
- parking lot0 m
- parking lot0 m
- parking lot0 m
- transit stop: Wilmington Avenue1 m
- transit stop: Finch Avenue at Dufferin Street3 m
- transit stop: Dufferin Street at Finch Avenue West North Side9 m
- parking lot10 m
- transit stop: Opposite 685 Finch Aveue West - St Bernard's Residence10 m
- transit stop: Dufferin Street at Martin Ross Avenue14 m
- transit stop: Dufferin Street at Supertest Road17 m
- transit stop: DUFFERIN ST STOP # 718017 m
- parking lot19 m
- parking lot22 m
- transit stop: 685 Finch Avenue West32 m
- transit stop: 715 Finch Avenue West32 m
- retail: 'Convenience Store'33 m
- transit stop: Wilmington Avenue34 m
- parking lot35 m
- transit stop: Dufferin Street at Supertest Road36 m
- parking lot38 m
- transit stop: Dufferin Street at Martin Ross Avenue40 m
- transit stop: 625 Finch Avenue West43 m
- parking lot43 m
- parking lot46 m
- transit stop46 m
- transit stop: Dufferin Street at Finch Avenue West North Side46 m
- parking lot48 m
- parking lot48 m
- parking lot51 m
- transit stop: 4610 Dufferin Street54 m
- parking lot56 m
- parking lot58 m
- parking lot58 m
- parking lot60 m
- retail61 m
- parking lot62 m
- transit stop: Wilmington Ave at Cedar Springs Grove62 m
- parking lot62 m
- restaurant: Eisenberg’s Sandwich Co.63 m
- transit stop: Dufferin Street at Finch Avenue West South Side63 m
- retail: Dufferin/Finch Auto Sales63 m
- parking lot64 m
- transit stop: Opposite 625 Finch Aveue West65 m
- parking lot68 m
- parking lot70 m
- transit stop: Antibes Drive at Torresdale Ave70 m
- retail: Majer Hockey Sports Excellence75 m
- parking lot75 m
- restaurant: What a Bagel79 m
- retail87 m
- parking lot88 m
- restaurant: Pho Plus92 m
- parking lot92 m
- parking lot94 m
- restaurant: Fresh Burger96 m
- retail: Coppa's Fresh Market96 m
- transit stop: Finch Avenue at Dufferin Street97 m
- restaurant: Elisa Cart Korean Tapas99 m
- parking lot99 m
- transit stop: Wilmington Ave at Finch Ave W100 m
- transit stop: Dufferin Street at Dolomite Drive102 m
- parking lot103 m
- restaurant: Cora104 m
- retail: North York Kia106 m
- parking lot107 m
- transit stop: Dufferin Street at Finch Avenue West South Side107 m
- parking lot107 m
- cafe: Tim Hortons107 m
- retail: Living Expressions Furniture & Home Accents107 m
- parking lot108 m
- transit stop: Dufferin Street at Finch Avenue West South Side110 m
- retail: Circle K110 m
- parking lot111 m
- parking lot112 m
Park profile
Five-axis radar across the structural dimensions.
Citywide percentile ranks
Across all Toronto parks in the dataset.
- Overall vitality71th
- Edge activation24th
- Connectivity94th
- Amenity diversity96th
- Natural comfort88th
- Enclosure45th
Most similar parks
Closest in metric space across the five structural dimensions.
- Roding ParkRavine / Naturalized Park43
- Chalkfarm ParkWaterfront Park39
- L'Amoreaux North ParkWaterfront Park44
- Morningside ParkRavine / Naturalized Park40
- Knob Hill ParkWaterfront Park40
Most opposite parks
Furthest in metric space. Useful for recognising what kind of park this isn’t.
- Joseph Burr Tyrrell ParkUrban Plaza50
- Queen'S Quay Traffic IslandWaterfront Park49
- Bernard Avenue Road AllowanceUrban Plaza54
- ALEX WILSON COMMUNITY GARDEN - Open Green SpaceUrban Plaza59
- Manor Community GreenUrban Plaza57
Human activity signals: not available
No activity signals have landed for this park yet. The model has scored its physical form but it can’t yet say how often it’s programmed, photographed, or walked through. See /data-ethics for what we will and will not collect.
Does this score feel accurate?
Your read of G. Ross Lord Parkmatters. We’re testing whether the model lines up with how people actually use the park. Submissions are stored locally; no account needed.
Tell us how this park feels
We measure structure (canopy, edges, connectivity). You measure feeling. Both matter, and disagreement is itself useful civic data.
What would improve this park?
Generated from the weakest measured dimensions: a starting point, not a prescription.
- Activate the edges: encourage cafés, retail or community uses on the streets that face the park; replace blank or parking-lot edges where possible.
- Diversify what people can do in the park (playground, washroom, water, shade, performance, sport, garden): even small additions raise this score.
- Mitigate border vacuums (highways, rail, parking) with active programming on the still-permeable edges and treat the hostile edge as a design challenge.
Data sources
- City of Toronto Open Data: Parks (Green Space)Polygon boundaries, official names, types.
- Parks & Recreation FacilitiesInventory of in-park amenities (washrooms, fields, rinks…).
- Toronto Pedestrian NetworkSidewalk segments around and through parks; estimated park entrances.
- Toronto Centreline V2Street segments + intersection nodes near park edges; trails and walkways.
- Toronto 3D MassingBuilding footprints + heights for edge-building counts, frontage density, and tower-in-the-park risk.
- Toronto Treed AreaTree canopy share inside park polygons via stratified-grid sampling.
- Toronto Waterbodies & RiversWater surface inside parks + nearest-water distance for cooling.
- Ravine & Natural Feature ProtectionRavine overlap as a cooling / natural-comfort signal.
- Toronto Street Tree InventoryTree count + density inside park polygons.
- Neighbourhood Profiles(Pending) Equity context proxy.
- OpenStreetMap (Overpass API)Cafés, restaurants, retail, transit stops, parking, highways, rail.