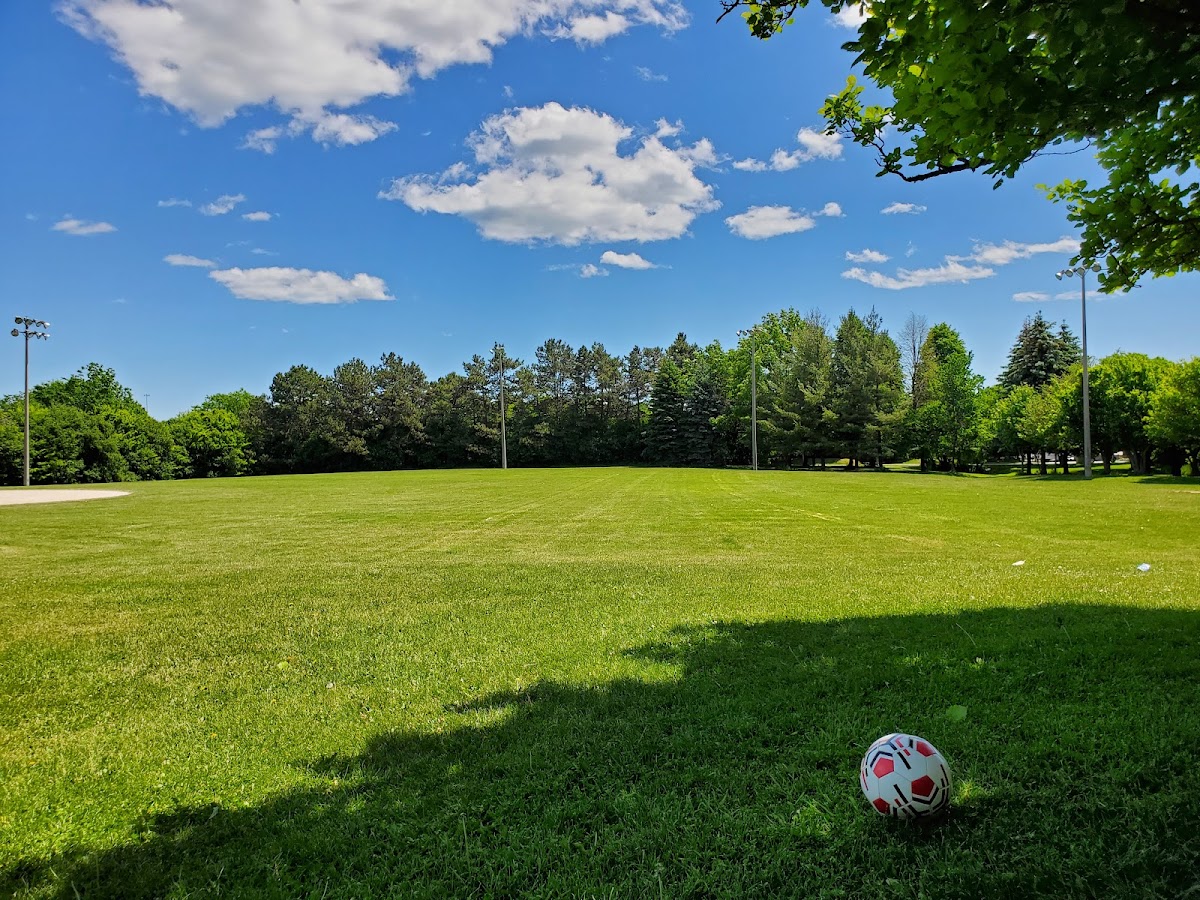
Burrows Hall Park
Ravine / Naturalized Park, above average overall (score 41, rank ~79th percentile). Strongest: natural comfort; weakest: enclosure.
Photo by Nobarun Dey via Google Places · cached 5/9/2026
Burrows Hall Park scores 41 / 100. Strongest dimensions: natural comfort and connectivity. Weakest: edge activation (0). Border-vacuum risk is elevated (36). This score is a transparent reading of Jane Jacobs-style vitality factors, not a definitive judgment.
Area · 9.76 ha
Weighted across six dimensions · confidence 72%
Scores are not bell-curved. Percentiles and expected scores provide context without changing the underlying model.
Loading map…
The parks map is loading.
Explain this score
Where did the 41 come from? Each weighted contribution against a neutral 50 baseline. Green = pushed up; red = pulled down.
Sum of contributions = the headline score. A negative bar means that dimension dragged the park below the city-wide neutral baseline.
Why this park works
Burrows Hall Park works because its natural comfort score (79) is in the top tier and its connectivity (68) is also top quartile (47% tree canopy provides real shade; it sits inside the ravine system).
What limits this park
Burrows Hall Park is held back by enclosure (50, bottom quartile): no mid-rise frontage to provide eyes on the park; border-vacuum risk is also elevated (36).
Most distinctive characteristic
Most distinctive feature: exceptionally high natural comfort (79, top decile).
Jacobs reading
Burrows Hall Park is an ecological retreat. The urban-vitality numbers are low because the park exists outside the everyday city. That's the point of it.
Performance in context
- A modest overperformer for its ravine / naturalized park typology (+5 vs the median in large Ravine / Naturalized Park ravine).
Typology classification
Classified as Ravine / Naturalized Park: 75% ravine overlap, 47% canopy. Secondary read: Corridor / Linear Park (shape elongation 2.1× a circle of equal area).
Edge Activation
Within 100 m of the park edge: 13 active uses (transit_stop, retail, restaurant) and 10 dead/hostile uses (parking_lot, highway). Active edges keep "eyes on the park" through the day; parking lots, blank institutional walls, rail and highway frontages drain street life.
Source: OSM POIs (amenity/shop) + Toronto Building Footprints + land use
Connectivity
Connectivity blends paths, intersections, transit, entrances, and edge density. This park has 15 mapped paths/walkways and 40 sidewalk segments within 50 m; 16 street intersections within 100 m; 15 transit stops within a 400 m walk; 3 estimated access points across ~2,283 m of perimeter. moderate edge density, small superblock penalty applied. Source coverage: centreline, pedestrian_network, transit_osm.
Source: Toronto Centreline V2 + Pedestrian Network + OSM transit stops
Amenity Diversity
2 distinct amenity types in the park (playground, sports_field). Diversity, not raw count, drives the score so a park with many distinct activity types can outrank a larger park that repeats the same use.
Source: Toronto Parks & Recreation Facilities + OSM amenity tags
Natural Comfort
Natural-comfort components for this park: 46.6% estimated tree canopy; 75.3% inside the ravine system; 3.4% water surface; 85 city-mapped trees inside the polygon (8.7/ha). Reading: ravine-cooled. Source coverage: treed_area, ravine, waterbodies, street_trees. Impervious surface is approximated (Toronto's authoritative layer ships only as a raster GeoTIFF).
Source: Toronto Treed Area + Ravine + Waterbodies + Street Tree Inventory
Enclosure / Eyes on Park
61 buildings within 25 m of the park edge (0 mid-rise, 61 low-rise, 0 tower); avg edge height 5.4 m (~2 floors); 2.7 buildings per 100 m of 2,283 m perimeter (moderate frontage density); edges are barely there or single-storey; no towers immediately adjacent. "Eyes on the park" come strongest from the 0 mid-rise edge buildings.
Source: Toronto 3D Massing (building footprints + heights)
Border Vacuum Risk
Border-vacuum factors within 50 m of the park: parking_lot, parking_lot, parking_lot. Jacobs warned that highways, rail, parking lots and blank institutional edges act as "vacuums" that suppress foot traffic and isolate the park from its neighbourhood.
Source: Toronto Street Centreline (highways) + rail layer + OSM landuse + building footprints
Equity Context
Equity Context requires inputs not yet loaded for this park (Toronto Neighbourhood Profiles). Score is held at a neutral 50 with low confidence. Read with caution.
Source: Toronto Neighbourhood Profiles
Amenities (2 types · 2 records)
- playground
- sports field
Nearby active-edge features (43)
- parking lot11 m
- parking lot23 m
- retail: Teltonika29 m
- transit stop: Gateforth Drive41 m
- transit stop: Washburn Way at Sheppard Ave E48 m
- parking lot49 m
- restaurant: Barrio Fiesta50 m
- parking lot53 m
- transit stop: Washburn Way53 m
- transit stop: Lapsley Road54 m
- retail: Bun King Bakery59 m
- parking lot59 m
- parking lot64 m
- retail: Lapsley Food and Conveniences68 m
- transit stop: Washburn Way at Sheppard Ave E74 m
- parking lot76 m
- retail: Green Merchant Cannabis Boutique76 m
- transit stop: Gateforth Drive77 m
- parking lot81 m
- parking lot82 m
- highway: Highway 401 Collector87 m
- retail: Sky Cleaaner88 m
- restaurant: Pizza Pizza91 m
- retail: Food Mart114 m
- parking lot118 m
- parking lot121 m
- retail122 m
- parking lot122 m
- retail127 m
- transit stop127 m
- parking lot130 m
- parking lot141 m
- highway: Highway 401 Collector150 m
- retail: Spiceland Super Market150 m
- transit stop153 m
- transit stop: Milner Ave at Novopharm Court155 m
- restaurant: Veerar165 m
- restaurant: Popular Pizza170 m
- retail175 m
- parking lot179 m
- parking lot181 m
- parking lot186 m
- highway: Highway 401 Express198 m
Park profile
Five-axis radar across the structural dimensions.
Citywide percentile ranks
Across all Toronto parks in the dataset.
- Overall vitality79th
- Edge activation21th
- Connectivity87th
- Amenity diversity86th
- Natural comfort91th
- Enclosure15th
Most similar parks
Closest in metric space across the five structural dimensions.
- Mccowan ParkRavine / Naturalized Park44
- Mcdairmid Woods ParkRavine / Naturalized Park37
- Colonel Danforth ParkWaterfront Park38
- E.T. Seton ParkRavine / Naturalized Park35
- Charles Sauriol Conservation AreaWaterfront Park35
Most opposite parks
Furthest in metric space. Useful for recognising what kind of park this isn’t.
- ALEX WILSON COMMUNITY GARDEN - Open Green SpaceUrban Plaza59
- Joseph Burr Tyrrell ParkUrban Plaza50
- Bernard Avenue Road AllowanceUrban Plaza54
- Queen'S Quay Traffic IslandWaterfront Park49
- Sonya'S ParkUrban Plaza60
Visitor signals
Public attention measured by Google Places aggregates. This proxies attention, not occupancy. Aggregate-only: no usernames, no review text, no extra photos beyond the cached hero.
p43 citywide · p51 within Ravine / Naturalized Park
Source: Google Places API · match high (0.98 composite confidence) · last refreshed 5/9/2026. Privacy contract. Measures public attention, not occupancy.
Human activity signals: not available
No activity signals have landed for this park yet. The model has scored its physical form but it can’t yet say how often it’s programmed, photographed, or walked through. See /data-ethics for what we will and will not collect.
Does this score feel accurate?
Your read of Burrows Hall Parkmatters. We’re testing whether the model lines up with how people actually use the park. Submissions are stored locally; no account needed.
Tell us how this park feels
We measure structure (canopy, edges, connectivity). You measure feeling. Both matter, and disagreement is itself useful civic data.
What would improve this park?
Generated from the weakest measured dimensions: a starting point, not a prescription.
- Activate the edges: encourage cafés, retail or community uses on the streets that face the park; replace blank or parking-lot edges where possible.
- Diversify what people can do in the park (playground, washroom, water, shade, performance, sport, garden): even small additions raise this score.
- Mitigate border vacuums (highways, rail, parking) with active programming on the still-permeable edges and treat the hostile edge as a design challenge.
Data sources
- City of Toronto Open Data: Parks (Green Space)Polygon boundaries, official names, types.
- Parks & Recreation FacilitiesInventory of in-park amenities (washrooms, fields, rinks…).
- Toronto Pedestrian NetworkSidewalk segments around and through parks; estimated park entrances.
- Toronto Centreline V2Street segments + intersection nodes near park edges; trails and walkways.
- Toronto 3D MassingBuilding footprints + heights for edge-building counts, frontage density, and tower-in-the-park risk.
- Toronto Treed AreaTree canopy share inside park polygons via stratified-grid sampling.
- Toronto Waterbodies & RiversWater surface inside parks + nearest-water distance for cooling.
- Ravine & Natural Feature ProtectionRavine overlap as a cooling / natural-comfort signal.
- Toronto Street Tree InventoryTree count + density inside park polygons.
- Neighbourhood Profiles(Pending) Equity context proxy.
- OpenStreetMap (Overpass API)Cafés, restaurants, retail, transit stops, parking, highways, rail.