Don Valley Golf Course
Waterfront Park, below average overall (score 28, rank ~22th percentile). Strongest: natural comfort; weakest: enclosure.
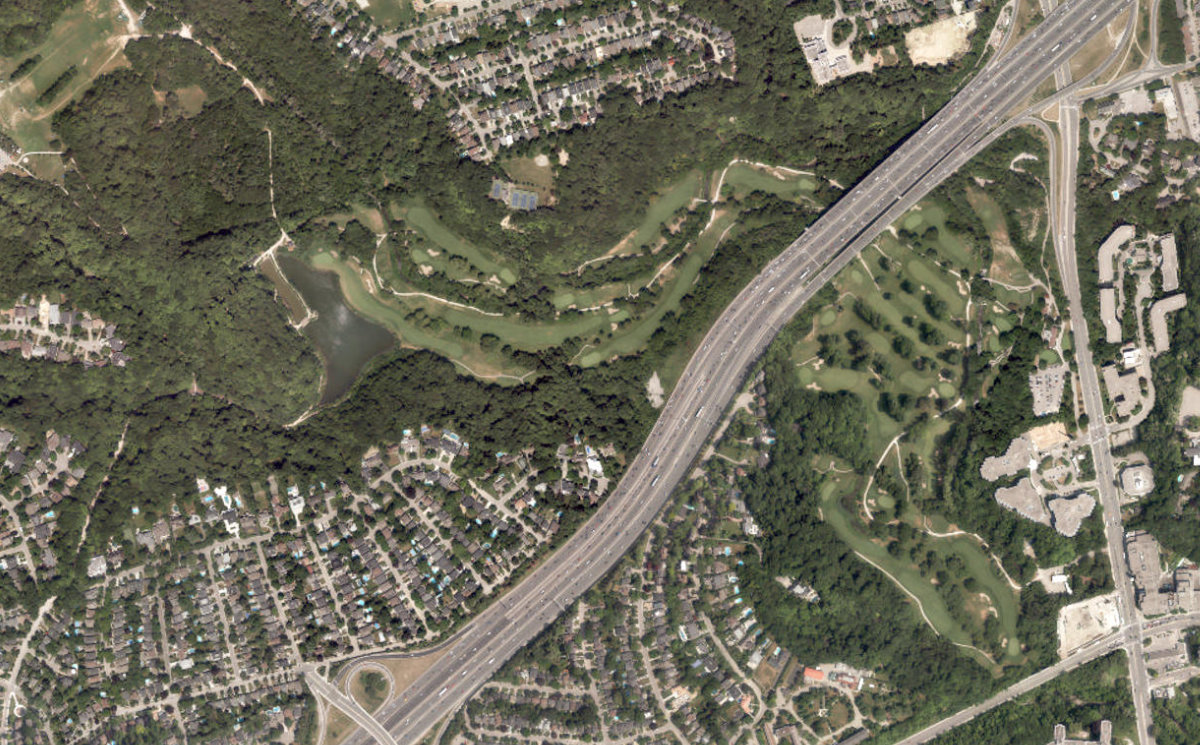
Aerial, City of Toronto orthophoto, ~8 cm/px source · cached 5/9/2026
Don Valley Golf Course scores 28.1 / 100. Strongest dimensions: natural comfort and connectivity. Weakest: amenity diversity (0). Border-vacuum risk is elevated (100). This score is a transparent reading of Jane Jacobs-style vitality factors, not a definitive judgment.
Area · 74.86 ha
Weighted across six dimensions · confidence 63%
Scores are not bell-curved. Percentiles and expected scores provide context without changing the underlying model.
Loading map…
The parks map is loading.Explain this score
Where did the 28 come from? Each weighted contribution against a neutral 50 baseline. Green = pushed up; red = pulled down.
Sum of contributions = the headline score. A negative bar means that dimension dragged the park below the city-wide neutral baseline.
Why this park works
Don Valley Golf Course works because its natural comfort score (71) is above average and its connectivity (63) is also top quartile (it sits inside the ravine system; water is part of the park).
What limits this park
Don Valley Golf Course is held back by enclosure (48, bottom quartile); border-vacuum risk is also elevated (100).
Most distinctive characteristic
Most distinctive feature: exceptionally low enclosure (48, bottom quartile).
Jacobs reading
Don Valley Golf Course is currently underperforming on both axes: neither integrated into the city nor offering deep natural respite. A candidate for design intervention.
Tradeoffs
- High connectivity coexists with high border-vacuum risk (100): much of that connectivity is to highways, rail, or parking lots, not to neighbourhoods.
Performance in context
- Reads as a modest underperformer relative to comparable parks (gap -6; cohort: very large Waterfront Park waterfront).
Typology classification
Classified as Waterfront Park: 7% water surface inside park. Secondary read: Ravine / Naturalized Park (100% ravine overlap, 29% canopy).
Edge Activation
Within 100 m of the park edge: 22 active uses (transit_stop, restaurant, cafe, retail) and 39 dead/hostile uses (highway, parking_lot). Active edges keep "eyes on the park" through the day; parking lots, blank institutional walls, rail and highway frontages drain street life.
Source: OSM POIs (amenity/shop) + Toronto Building Footprints + land use
Connectivity
Connectivity blends paths, intersections, transit, entrances, and edge density. This park has 21 mapped paths/walkways and 46 sidewalk segments within 50 m; 12 street intersections within 100 m; 40 transit stops within a 400 m walk; 7 estimated access points across ~7,146 m of perimeter. low edge density, significant superblock penalty applied. Source coverage: centreline, pedestrian_network, transit_osm.
Source: Toronto Centreline V2 + Pedestrian Network + OSM transit stops
Amenity Diversity
No amenities recorded. Score is 0 until inventory is loaded.
Source: Toronto Parks & Recreation Facilities + OSM amenity tags
Natural Comfort
Natural-comfort components for this park: 28.8% estimated tree canopy; 100.0% inside the ravine system; 6.8% water surface; 47 city-mapped trees inside the polygon (0.6/ha). Reading: ravine-cooled. Source coverage: treed_area, ravine, waterbodies, street_trees. Impervious surface is approximated (Toronto's authoritative layer ships only as a raster GeoTIFF).
Source: Toronto Treed Area + Ravine + Waterbodies + Street Tree Inventory
Enclosure / Eyes on Park
122 buildings within 25 m of the park edge (14 mid-rise, 108 low-rise, 0 tower); avg edge height 6.8 m (~2 floors); 1.7 buildings per 100 m of 7,146 m perimeter (moderate frontage density); edges are low-rise (mostly 2 to 3 floors); no towers immediately adjacent. "Eyes on the park" come strongest from the 14 mid-rise edge buildings.
Source: Toronto 3D Massing (building footprints + heights)
Border Vacuum Risk
Border-vacuum factors within 50 m of the park: Highway 401 Collector, Highway 401 Express, Highway 401 Express, Highway 401 Collector, Highway 401 Express, Highway 401 Collector, Highway 401 Collector, Yonge Street, Yonge Street, Yonge Street, Yonge Street, parking_lot, Yonge Street, Yonge Street, Yonge Street, Yonge Street, parking_lot, Yonge Street, Yonge Street, Yonge Street. Jacobs warned that highways, rail, parking lots and blank institutional edges act as "vacuums" that suppress foot traffic and isolate the park from its neighbourhood.
Source: Toronto Street Centreline (highways) + rail layer + OSM landuse + building footprints
Equity Context
Equity Context requires inputs not yet loaded for this park (Toronto Neighbourhood Profiles). Score is held at a neutral 50 with low confidence. Read with caution.
Source: Toronto Neighbourhood Profiles
Amenities (0)
No amenities recorded for this park.
Nearby active-edge features (80)
- highway: Highway 401 Express0 m
- highway: Highway 401 Express0 m
- highway: Highway 401 Collector0 m
- parking lot0 m
- parking lot0 m
- highway: Highway 401 Collector1 m
- highway: Yonge Street14 m
- highway: Yonge Street18 m
- highway: Yonge Street19 m
- highway: Highway 401 Collector23 m
- highway: Yonge Street23 m
- highway: Yonge Street25 m
- transit stop: William Carson Crescent26 m
- highway: Yonge Street34 m
- highway: Yonge Street36 m
- highway: Yonge Street38 m
- highway: Highway 401 Express41 m
- highway: Yonge Street42 m
- highway: Highway 401 Collector42 m
- cafe: Tim Hortons42 m
- highway: Yonge Street46 m
- highway: Yonge Street47 m
- parking lot54 m
- parking lot60 m
- restaurant: Subway63 m
- highway: Yonge Street64 m
- parking lot64 m
- transit stop: Yonge / Wilson Northwest Entrance65 m
- parking lot65 m
- transit stop: Yonge Street at Lord Seaton Road65 m
- restaurant: Auberge du Pommier Restaurant66 m
- transit stop: York Mills Road67 m
- transit stop: York Mills Station68 m
- transit stop: Yonge St at Wilson Ave71 m
- restaurant: Swiss Chalet71 m
- retail: Gateway Newsstands/Public Mobile72 m
- transit stop73 m
- highway: Yonge Street73 m
- transit stop: William Carson Crescent77 m
- transit stop: York Mills Station82 m
- highway: Yonge Street83 m
- highway: Highway 401 Collector83 m
- transit stop84 m
- highway: Yonge Street84 m
- parking lot85 m
- transit stop: 4025 Yonge Entrance86 m
- transit stop: York Mills Station86 m
- highway: Yonge Street86 m
- parking lot86 m
- parking lot88 m
- highway: Yonge Street89 m
- highway: Highway 401 Collector90 m
- transit stop: Yonge Street90 m
- highway: Highway 401 Collector91 m
- parking lot92 m
- parking lot93 m
- parking lot95 m
- transit stop95 m
- cafe: Tim Hortons96 m
- cafe: Starbucks97 m
- transit stop: York Mills Station98 m
- highway: Yonge Street101 m
- highway: Highway 401 Express102 m
- transit stop: York Mills Station102 m
- parking lot105 m
- transit stop: Yonge Street at Lord Seaton Road107 m
- highway: Yonge Street108 m
- highway: Yonge Street110 m
- parking lot110 m
- transit stop: Yonge Street112 m
- transit stop: York Mills Station114 m
- restaurant: Druxys116 m
- restaurant: Chicken Quarter116 m
- highway: Highway 401 Express118 m
- transit stop: York Mills Station119 m
- restaurant: Bento box122 m
- parking lot124 m
- transit stop: York Mills Station128 m
- restaurant: Mr Souvlaki129 m
- highway: Yonge Street131 m
Park profile
Five-axis radar across the structural dimensions.
Citywide percentile ranks
Across all Toronto parks in the dataset.
- Overall vitality22th
- Edge activation31th
- Connectivity79th
- Amenity diversity39th
- Natural comfort85th
- Enclosure11th
Most similar parks
Closest in metric space across the five structural dimensions.
- Humber Valley Golf CourseRavine / Naturalized Park31
- Hampshire Heights ParkWaterfront Park37
- Weston Golf And Country ClubRavine / Naturalized Park28
- Rouge Park - Rouge Beach ParkWaterfront Park29
- Misty Hills ParkRavine / Naturalized Park35
Most opposite parks
Furthest in metric space. Useful for recognising what kind of park this isn’t.
- Joseph Burr Tyrrell ParkUrban Plaza50
- Leslie Grove ParkParkette68
- ALEX WILSON COMMUNITY GARDEN - Open Green SpaceUrban Plaza59
- Bernard Avenue Road AllowanceUrban Plaza54
- Sonya'S ParkUrban Plaza60
Human activity signals: not available
No activity signals have landed for this park yet. The model has scored its physical form but it can’t yet say how often it’s programmed, photographed, or walked through. See /data-ethics for what we will and will not collect.
Does this score feel accurate?
Your read of Don Valley Golf Coursematters. We’re testing whether the model lines up with how people actually use the park. Submissions are stored locally; no account needed.
Tell us how this park feels
We measure structure (canopy, edges, connectivity). You measure feeling. Both matter, and disagreement is itself useful civic data.
What would improve this park?
Generated from the weakest measured dimensions: a starting point, not a prescription.
- Activate the edges: encourage cafés, retail or community uses on the streets that face the park; replace blank or parking-lot edges where possible.
- Diversify what people can do in the park (playground, washroom, water, shade, performance, sport, garden): even small additions raise this score.
- Encourage mid-rise, windowed frontages around the park so residents have direct sightlines onto it.
- Mitigate border vacuums (highways, rail, parking) with active programming on the still-permeable edges and treat the hostile edge as a design challenge.
Data sources
- City of Toronto Open Data: Parks (Green Space)Polygon boundaries, official names, types.
- Parks & Recreation FacilitiesInventory of in-park amenities (washrooms, fields, rinks…).
- Toronto Pedestrian NetworkSidewalk segments around and through parks; estimated park entrances.
- Toronto Centreline V2Street segments + intersection nodes near park edges; trails and walkways.
- Toronto 3D MassingBuilding footprints + heights for edge-building counts, frontage density, and tower-in-the-park risk.
- Toronto Treed AreaTree canopy share inside park polygons via stratified-grid sampling.
- Toronto Waterbodies & RiversWater surface inside parks + nearest-water distance for cooling.
- Ravine & Natural Feature ProtectionRavine overlap as a cooling / natural-comfort signal.
- Toronto Street Tree InventoryTree count + density inside park polygons.
- Neighbourhood Profiles(Pending) Equity context proxy.
- OpenStreetMap (Overpass API)Cafés, restaurants, retail, transit stops, parking, highways, rail.