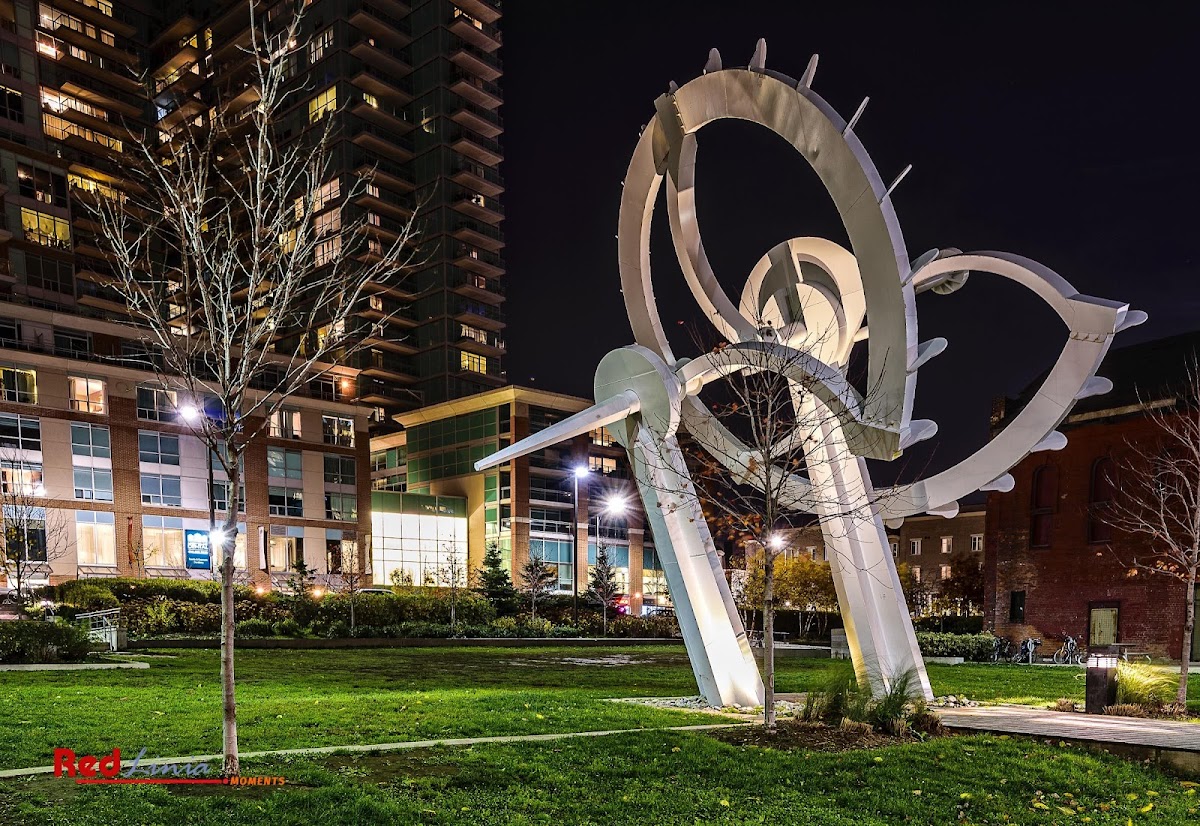
Liberty Village Park
Civic Square, one of the city's strongest overall (score 55, rank ~98th percentile). Strongest: edge activation; weakest: natural comfort.
Photo by Eugene Akimov via Google Places · cached 5/9/2026
Liberty Village Park scores 55.1 / 100. Strongest dimensions: connectivity and enclosure / eyes on park. Weakest: amenity diversity (11.9). Border-vacuum risk is low. This score is a transparent reading of Jane Jacobs-style vitality factors, not a definitive judgment.
Area · 0.42 ha
Weighted across six dimensions · confidence 68%
Scores are not bell-curved. Percentiles and expected scores provide context without changing the underlying model.
Loading map…
The parks map is loading.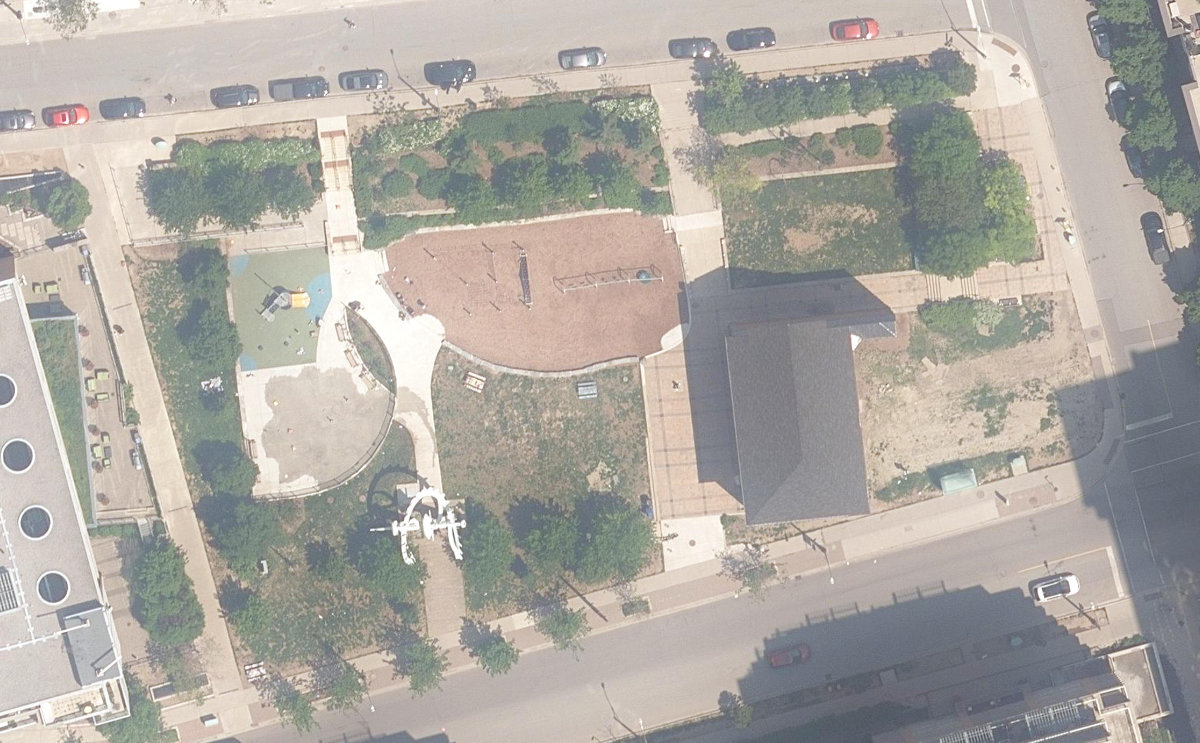
Explain this score
Where did the 55 come from? Each weighted contribution against a neutral 50 baseline. Green = pushed up; red = pulled down.
Sum of contributions = the headline score. A negative bar means that dimension dragged the park below the city-wide neutral baseline.
Why this park works
Liberty Village Park works because its edge activation score (57) is one of the city's strongest and its connectivity (76) is also top decile (its perimeter is lined with active uses).
What limits this park
Liberty Village Park doesn't have a clear weakness. Every measured dimension is at or above the middle of the pack.
Most distinctive characteristic
Most distinctive feature: exceptionally high edge activation (57, top decile).
Jacobs reading
Liberty Village Park sits between an urban social park and an ecological retreat: moderately useful for both, exceptionally suited to neither.
Tradeoffs
- Connectivity (76) significantly outpaces natural comfort (40): well placed in the city but offers little shade or ecological respite.
- 43 nearby towers cast wind and shadow without contributing canopy: passive surveillance is plentiful but human-scale comfort is not.
Performance in context
- This park is a strong overperformer for its cohort: raw 55 versus an expected 42 for similar parks (small Civic Square) (gap +13).
Typology classification
Classified as Civic Square: tower-walled, low canopy (0%), tight frontage: reads as a civic square. Secondary read: Urban Plaza (4201 m², paved (0% canopy), 35.8 buildings/100 m).
Edge Activation
Within 100 m of the park edge: 11 active uses (retail, cafe, restaurant, transit_stop) and 1 dead/hostile uses (parking_lot). Active edges keep "eyes on the park" through the day; parking lots, blank institutional walls, rail and highway frontages drain street life.
Source: OSM POIs (amenity/shop) + Toronto Building Footprints + land use
Connectivity
Connectivity blends paths, intersections, transit, entrances, and edge density. This park has 10 mapped paths/walkways and 16 sidewalk segments within 50 m; 13 street intersections within 100 m; 21 transit stops within a 400 m walk; 10 estimated access points across ~274 m of perimeter. edge density is healthy, no superblock penalty. Source coverage: centreline, pedestrian_network, transit_osm.
Source: Toronto Centreline V2 + Pedestrian Network + OSM transit stops
Amenity Diversity
1 distinct amenity types in the park (playground). Diversity, not raw count, drives the score so a park with many distinct activity types can outrank a larger park that repeats the same use.
Source: Toronto Parks & Recreation Facilities + OSM amenity tags
Natural Comfort
Natural-comfort components for this park: ~6.3% effective canopy (0.0% from contiguous tree polygons + scattered tree density); nearest waterbody ~804 m; 9 city-mapped trees inside the polygon (9.0/ha). Reading: exposed. Source coverage: waterbodies, street_trees. Impervious surface is approximated (Toronto's authoritative layer ships only as a raster GeoTIFF).
Source: Toronto Treed Area + Ravine + Waterbodies + Street Tree Inventory
Enclosure / Eyes on Park
98 buildings within 25 m of the park edge (35 mid-rise, 20 low-rise, 43 tower); avg edge height 35.5 m (~12 floors); 35.8 buildings per 100 m of 274 m perimeter (strong frontage density); edges lean tall but still framed; 43 towers ≥ 40 m within 25 m of the edge. "Eyes on the park" come strongest from the 35 mid-rise edge buildings.
Source: Toronto 3D Massing (building footprints + heights)
Border Vacuum Risk
Park edges face the city. No significant border vacuum detected.
Source: Toronto Street Centreline (highways) + rail layer + OSM landuse + building footprints
Equity Context
Equity Context requires inputs not yet loaded for this park (Toronto Neighbourhood Profiles). Score is held at a neutral 50 with low confidence. Read with caution.
Source: Toronto Neighbourhood Profiles
Amenities (1 types · 1 records)
- playground
Nearby active-edge features (57)
- transit stop0 m
- retail: Green Cleaners22 m
- cafe: Hello Coffee22 m
- retail: Liberty Convenience24 m
- retail: LV Vapes39 m
- restaurant: 'Ono Poké Bar43 m
- cafe: Ton Ton Matcha47 m
- retail: spark's50 m
- parking lot77 m
- restaurant: eb Breakfast Co.80 m
- restaurant: Maurya East Indian Roti90 m
- retail: Liberty Towers Presentation Centre100 m
- retail: Circle K100 m
- retail: M&M Food Market123 m
- transit stop: Lynn Williams Street128 m
- parking lot133 m
- restaurant: Liberty Soho134 m
- retail: The Bone & Biscuit Co.140 m
- rail146 m
- rail: Oakville Subdivision147 m
- rail: Union Station Rail Corridor147 m
- rail148 m
- rail152 m
- rail: Oakville Subdivision152 m
- rail: Oakville Subdivision153 m
- rail: Oakville Subdivision156 m
- rail: Oakville Subdivision162 m
- restaurant: Brazen Head Irish Pub163 m
- restaurant: Panago164 m
- retail: Vent Blow Dry Bar166 m
- rail: Oakville Subdivision166 m
- rail: Oakville Subdivision169 m
- restaurant: Thindi169 m
- rail: Oakville Subdivision170 m
- transit stop172 m
- parking lot172 m
- cafe: Aroma Espresso Bar172 m
- rail: Oakville Subdivision173 m
- rail177 m
- rail: Union Station Rail Corridor178 m
- rail: Oakville Subdivision183 m
- parking lot183 m
- rail: Oakville Subdivision184 m
- transit stop: Exhibition184 m
- rail185 m
- parking lot: Impark186 m
- retail: COBS Bread187 m
- restaurant: Nodo Liberty188 m
- rail: Union Station Rail Corridor189 m
- restaurant: Kibo Sushi192 m
- rail: Union Station Rail Corridor192 m
- rail: Union Station Rail Corridor195 m
- rail: Union Station Rail Corridor196 m
- retail: Axe & Hatchet198 m
- retail: Canvas cannabis199 m
- rail: Union Station Rail Corridor200 m
- rail200 m
Park profile
Five-axis radar across the structural dimensions.
Citywide percentile ranks
Across all Toronto parks in the dataset.
- Overall vitality98th
- Edge activation97th
- Connectivity96th
- Amenity diversity79th
- Natural comfort38th
- Enclosure75th
Most similar parks
Closest in metric space across the five structural dimensions.
- Glen Stewart ParkRavine / Naturalized Park49
- James Canning GardensUrban Plaza58
- Art Eggleton ParkUrban Plaza56
- Keele - Mulock ParketteParkette54
- HOLY CROSS CATHOLIC SECONDARY SCHOOL - Building GroundsParkette51
Most opposite parks
Furthest in metric space. Useful for recognising what kind of park this isn’t.
- Trca Lands ( 26)Ravine / Naturalized Park27
- Toronto Islands - Muggs Island ParkRavine / Naturalized Park25
- Rouge ParkRavine / Naturalized Park26
- Rouge ParkRavine / Naturalized Park28
- Rouge ParkWaterfront Park25
Visitor signals
Public attention measured by Google Places aggregates. This proxies attention, not occupancy. Aggregate-only: no usernames, no review text, no extra photos beyond the cached hero.
p89 citywide · p69 within Civic Square
Source: Google Places API · match unverified (0.00 composite confidence) · last refreshed 5/9/2026. Privacy contract. Measures public attention, not occupancy.
Human activity signals: not available
No activity signals have landed for this park yet. The model has scored its physical form but it can’t yet say how often it’s programmed, photographed, or walked through. See /data-ethics for what we will and will not collect.
Does this score feel accurate?
Your read of Liberty Village Parkmatters. We’re testing whether the model lines up with how people actually use the park. Submissions are stored locally; no account needed.
Tell us how this park feels
We measure structure (canopy, edges, connectivity). You measure feeling. Both matter, and disagreement is itself useful civic data.
What would improve this park?
Generated from the weakest measured dimensions: a starting point, not a prescription.
- Diversify what people can do in the park (playground, washroom, water, shade, performance, sport, garden): even small additions raise this score.
- Increase canopy and reduce paved area. Shade and water features extend usable hours and seasons.
Data sources
- City of Toronto Open Data: Parks (Green Space)Polygon boundaries, official names, types.
- Parks & Recreation FacilitiesInventory of in-park amenities (washrooms, fields, rinks…).
- Toronto Pedestrian NetworkSidewalk segments around and through parks; estimated park entrances.
- Toronto Centreline V2Street segments + intersection nodes near park edges; trails and walkways.
- Toronto 3D MassingBuilding footprints + heights for edge-building counts, frontage density, and tower-in-the-park risk.
- Toronto Treed AreaTree canopy share inside park polygons via stratified-grid sampling.
- Toronto Waterbodies & RiversWater surface inside parks + nearest-water distance for cooling.
- Ravine & Natural Feature ProtectionRavine overlap as a cooling / natural-comfort signal.
- Toronto Street Tree InventoryTree count + density inside park polygons.
- Neighbourhood Profiles(Pending) Equity context proxy.
- OpenStreetMap (Overpass API)Cafés, restaurants, retail, transit stops, parking, highways, rail.